DYDX is finally showing strong reversal signals after months of downtrend.
What’s happening?
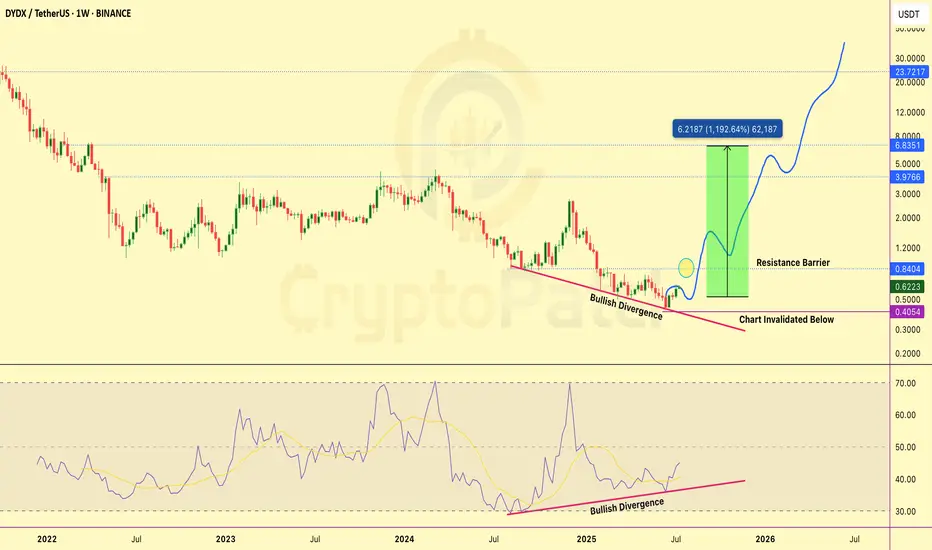
We’ve spotted a clear Bullish Divergence on both the price chart and RSI. While the price made lower lows, RSI is printing higher lows — a classic signal that selling pressure is weakening and buyers are stepping in quietly.
Key Levels to Watch:
🔹 Support (Invalidation Zone): $0.405
🔹 If price breaks below this level, the bullish setup is invalid.
🔹 Resistance Barrier: $0.84
Once DYDX closes above this level, a major breakout could unfold.
Upside Potential (if breakout confirmed): $0.84 / $3.97 / $6.83 / Bonus
RSI is also trending upward, confirming hidden strength in the move. Volume is gradually picking up too — another positive sign.
If this divergence plays out fully, we’re looking at a potential 10x+ move from here. Keep a close eye on the $0.84 breakout zone — it could be the ignition point for a major rally.
Always trade with SL and proper risk management.
This is NOT financial advice. Just sharing what I see on the charts.
What’s happening?
We’ve spotted a clear Bullish Divergence on both the price chart and RSI. While the price made lower lows, RSI is printing higher lows — a classic signal that selling pressure is weakening and buyers are stepping in quietly.
Key Levels to Watch:
🔹 Support (Invalidation Zone): $0.405
🔹 If price breaks below this level, the bullish setup is invalid.
🔹 Resistance Barrier: $0.84
Once DYDX closes above this level, a major breakout could unfold.
Upside Potential (if breakout confirmed): $0.84 / $3.97 / $6.83 / Bonus
RSI is also trending upward, confirming hidden strength in the move. Volume is gradually picking up too — another positive sign.
If this divergence plays out fully, we’re looking at a potential 10x+ move from here. Keep a close eye on the $0.84 breakout zone — it could be the ignition point for a major rally.
Always trade with SL and proper risk management.
This is NOT financial advice. Just sharing what I see on the charts.
Twitter: twitter.com/CryptoPatel
Telegram: t.me/OfficialCryptoPatel
Instagram: instagram.com/cryptopatel?utm_medium=copy_link
Telegram: t.me/OfficialCryptoPatel
Instagram: instagram.com/cryptopatel?utm_medium=copy_link
Thông báo miễn trừ trách nhiệm
Thông tin và ấn phẩm không có nghĩa là và không cấu thành, tài chính, đầu tư, kinh doanh, hoặc các loại lời khuyên hoặc khuyến nghị khác được cung cấp hoặc xác nhận bởi TradingView. Đọc thêm trong Điều khoản sử dụng.