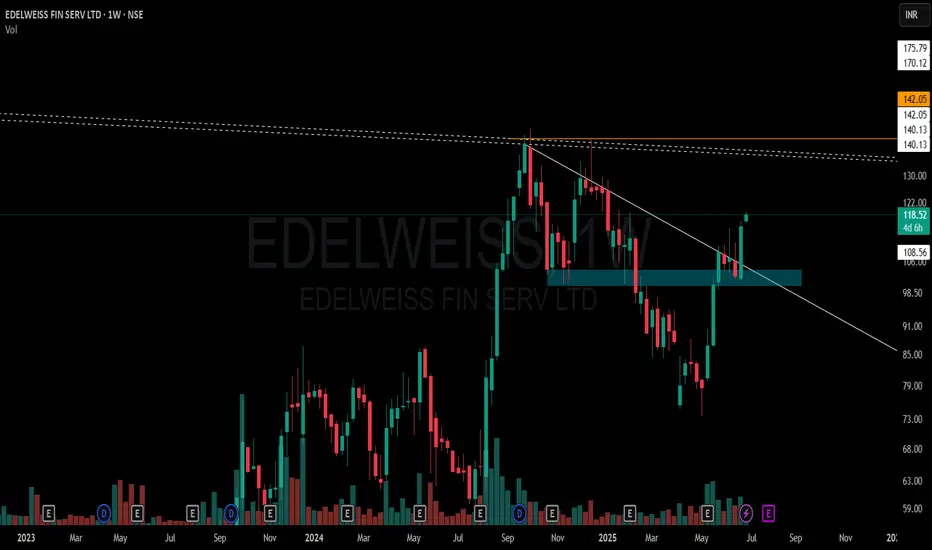
A few key observations on this weekly chart without any forecast bias:
🔹 White Solid Trendline – Marks the active CT (counter-trend) level which has now been decisively taken out.
🔹 Blue Zone – A previously tested supply and demand area has been regained and price is now sustaining above it.
🔹 White Dotted Lines – Multiple short-term weekly hindrances lie just above, acting as micro-resistances.
🔹 Orange Line – Reflects multi-timeframe level confluence and a known volume cluster region to watch ahead.
🔹 Volume has seen a healthy pickup during this breakout, suggesting participation.
📌 Not a recommendation. Just sharing chart structure and price behavior.
🎯 Master My Self-Made Trading Strategy
📈 Telegram (Learn Today): t.me/hashtaghammer
✅ WhatsApp (Learn Today): wa.me/919455664601
📈 Telegram (Learn Today): t.me/hashtaghammer
✅ WhatsApp (Learn Today): wa.me/919455664601
Bài đăng liên quan
Thông báo miễn trừ trách nhiệm
Thông tin và các ấn phẩm này không nhằm mục đích, và không cấu thành, lời khuyên hoặc khuyến nghị về tài chính, đầu tư, giao dịch hay các loại khác do TradingView cung cấp hoặc xác nhận. Đọc thêm tại Điều khoản Sử dụng.