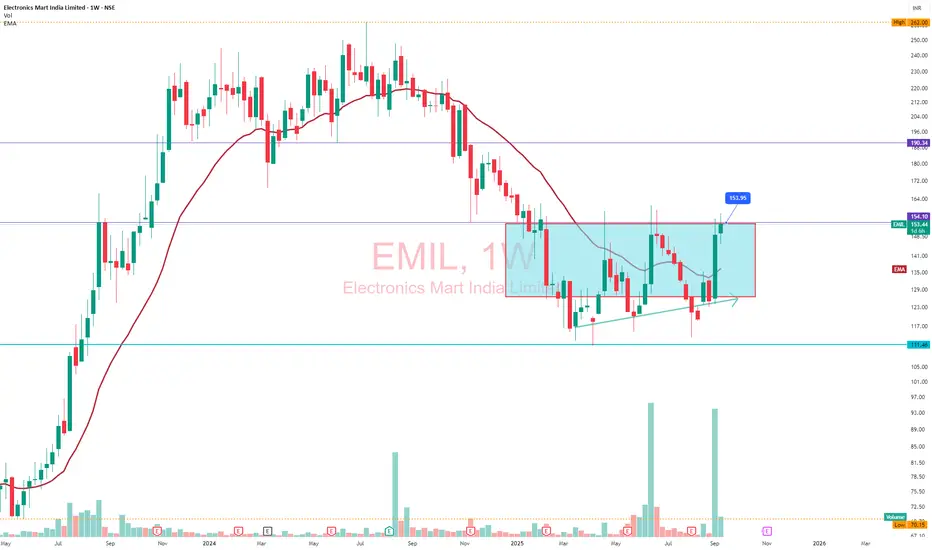
Electronics Mart India Ltd (EMIL) shows a strong bullish trend on the 1-month chart, with weekly growth gaining momentum throughout September 2025.
Watch out above 154 around... Look's good for 190 in short term.
Time Frame: Within Few Weeks.
Overview:
Weekly Price Movement (September 2025)
Week 1: EMIL began the month around ₹125, accelerating rapidly above ₹135 by the week’s end.
Week 2: The price broke out strongly to ₹145–₹150, reflecting increased buying volume and positive sentiment due to strong returns.
Week 3: The share advanced further, briefly touching highs of ₹153 before settling between ₹148–₹151.
Overall monthly gain: Nearly 22–24% increase.
Chart Pattern Analysis:
Trend Direction: Uptrend, as price created new short-term highs each week.
Pattern: Breakout above last month’s resistance zone near ₹130, followed by strong upward candles — typical of momentum-driven rallies.
Volume: Weekly volumes surged, confirming strength behind the move.
Volatility: The stock was volatile, but upward momentum prevailed as sellers failed to counter bullish pressure, with intra-week dips consistently getting bought.
Thông báo miễn trừ trách nhiệm
Thông tin và ấn phẩm không có nghĩa là và không cấu thành, tài chính, đầu tư, kinh doanh, hoặc các loại lời khuyên hoặc khuyến nghị khác được cung cấp hoặc xác nhận bởi TradingView. Đọc thêm trong Điều khoản sử dụng.
Thông báo miễn trừ trách nhiệm
Thông tin và ấn phẩm không có nghĩa là và không cấu thành, tài chính, đầu tư, kinh doanh, hoặc các loại lời khuyên hoặc khuyến nghị khác được cung cấp hoặc xác nhận bởi TradingView. Đọc thêm trong Điều khoản sử dụng.