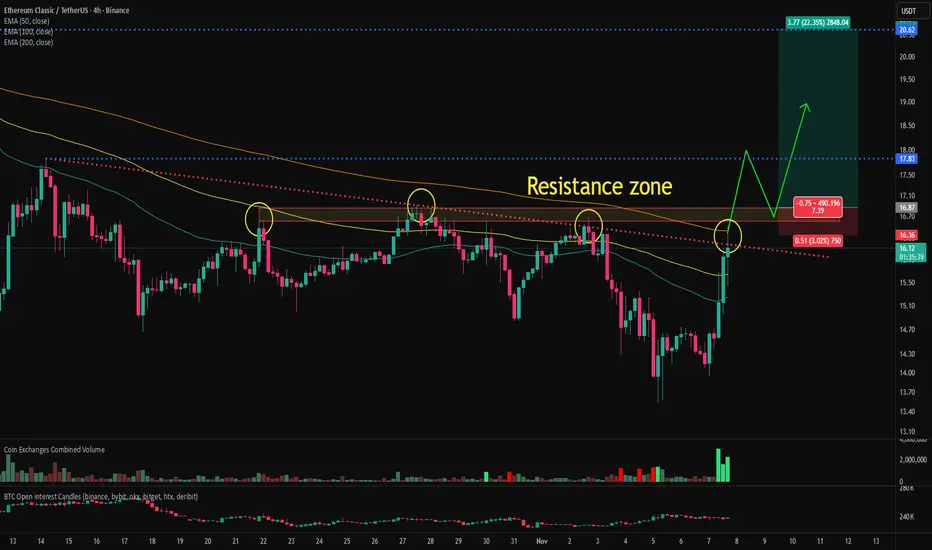
Ethereum Classic is currently attempting to break above the 200-period moving average, a key resistance level, and a major supply zone on the 4-hour chart. Although it’s facing resistance at the moment, a decisive breakout through these overlapping resistance zones could provide an attractive long-entry opportunity with a favorable risk-to-reward ratio.
Given that this resistance area has rejected multiple breakout attempts in the past, the probability of a successful breakout this time appears relatively high.
The ETC/BTC chart has also cleared several major resistance levels, suggesting that ETC could follow a similar pattern to recent strong performers such as ZEC, DASH, and 1INCH.

The bullish alignment on the ETC/BTC chart also indicates that Ethereum Classic is outperforming Bitcoin.
If Ethereum Classic confirms a breakout above the resistance zone, I will share an updated analysis on the subsequent price outlook.
Given that this resistance area has rejected multiple breakout attempts in the past, the probability of a successful breakout this time appears relatively high.
The ETC/BTC chart has also cleared several major resistance levels, suggesting that ETC could follow a similar pattern to recent strong performers such as ZEC, DASH, and 1INCH.
The bullish alignment on the ETC/BTC chart also indicates that Ethereum Classic is outperforming Bitcoin.
If Ethereum Classic confirms a breakout above the resistance zone, I will share an updated analysis on the subsequent price outlook.
Giao dịch đang hoạt động
It's right before breaking through the resistance zone.Ghi chú
A stronger-than-expected rally has occurred, showing clear signs of solid buying pressure on ETC. The previous key resistance zone is now likely to act as a strong support level, and if the price retraces toward this support area, it could present an attractive opportunity for a long position.I’ll provide an update if further movement occurs.
Follow me to get notified as soon as new analyses are posted.
support level
Đóng lệnh: đạt mục tiêu
Having reached the support zone, I am now executing the first of three planned partial entries for a long position.
Crypto trader. Scalping, counter-trend trading.
Check out my profile for more useful indicators.
Introduction to Bitcoin Chart Analysis and Indicators.
Youtube : youtube.com/@mensascalper
Check out my profile for more useful indicators.
Introduction to Bitcoin Chart Analysis and Indicators.
Youtube : youtube.com/@mensascalper
Thông báo miễn trừ trách nhiệm
Thông tin và ấn phẩm không có nghĩa là và không cấu thành, tài chính, đầu tư, kinh doanh, hoặc các loại lời khuyên hoặc khuyến nghị khác được cung cấp hoặc xác nhận bởi TradingView. Đọc thêm trong Điều khoản sử dụng.