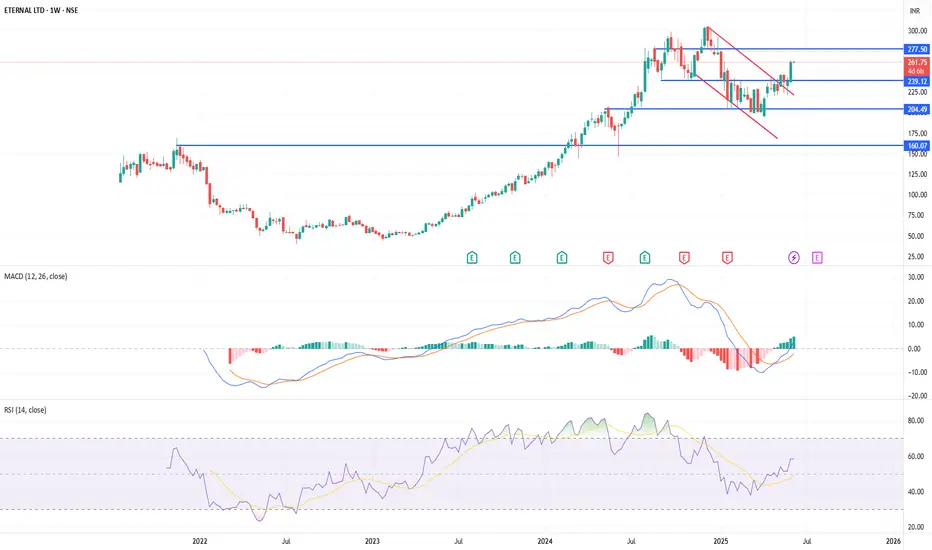
ETERNAL LTD is showing a positive technical setup on the weekly chart as of June 9, 2025. The stock has broken out of a falling wedge pattern and retested the same breakout zone of 230 levels, indicating a potential bullish reversal. Momentum indicators support the move, with the MACD moving upwards and the RSI rising to 58.5, suggesting strengthening buying interest without being overbought. This is just for educational purpose and not any recommendation.
Thông báo miễn trừ trách nhiệm
Thông tin và ấn phẩm không có nghĩa là và không cấu thành, tài chính, đầu tư, kinh doanh, hoặc các loại lời khuyên hoặc khuyến nghị khác được cung cấp hoặc xác nhận bởi TradingView. Đọc thêm trong Điều khoản sử dụng.
Thông báo miễn trừ trách nhiệm
Thông tin và ấn phẩm không có nghĩa là và không cấu thành, tài chính, đầu tư, kinh doanh, hoặc các loại lời khuyên hoặc khuyến nghị khác được cung cấp hoặc xác nhận bởi TradingView. Đọc thêm trong Điều khoản sử dụng.