🔎 Weekly Timeframe Levels & Technical Picture
1. Current Price Context
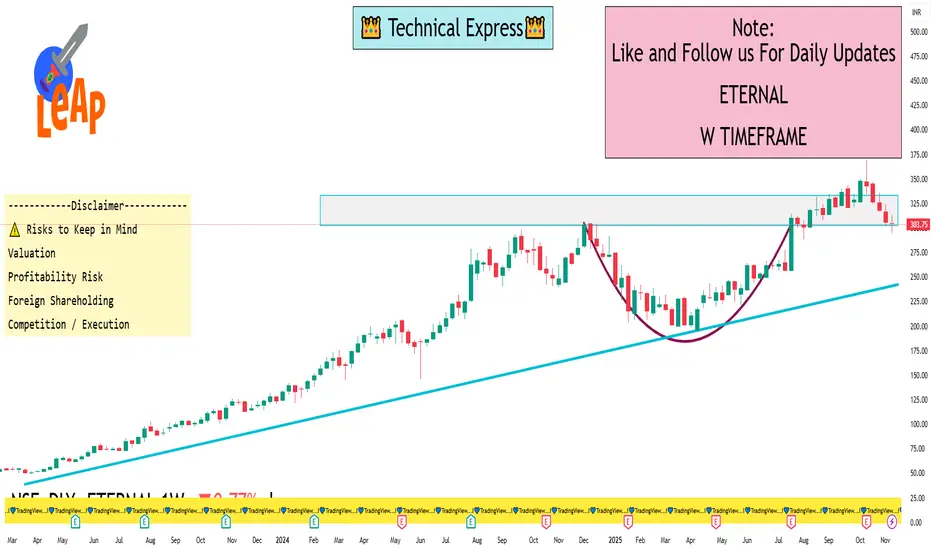
a) Eternal is trading around ~₹303–306.
b) On 5paisa, support levels: ~₹297.3 (S1), then ~₹290.8 (S2).
c) Their 200-day SMA (on weekly or daily) is around ~₹280.2 (etMoney data).
2. Trend Structure & Key Zones
a) Major Support Zone: ~₹290–300 — this is a psychologically important zone, and there’s technical support around here.
b) Resistance / Key Level: ~₹320 — based on multiple trader viewpoints, breaking decisively above 320 could change short-term bias.
c) According to etMoney, RSI on weekly is not overly strong; momentum is somewhat neutral-to-down.
3. Chart Patterns / Candlestick Signal
a) Some traders point to a bearish engulfing pattern on the weekly.
b) If the weekly closes below ~₹320 with this pattern, the bearish case gains strength (according to those traders).
c) On the flip side, if 320 holds and price bounces, we might see a retracement or consolidation rather than a full breakdown.
4. Valuation Risk / Fundamental Pressure
a) Eternal’s valuation is very rich: its P/E is extremely high, which concerns some market participants.
b) On the fundamental side: strong revenue growth is being driven by Blinkit (quick commerce), but profit pressures remain.
c) According to a report, losses might have peaked, but execution risk remains.
1. Current Price Context
a) Eternal is trading around ~₹303–306.
b) On 5paisa, support levels: ~₹297.3 (S1), then ~₹290.8 (S2).
c) Their 200-day SMA (on weekly or daily) is around ~₹280.2 (etMoney data).
2. Trend Structure & Key Zones
a) Major Support Zone: ~₹290–300 — this is a psychologically important zone, and there’s technical support around here.
b) Resistance / Key Level: ~₹320 — based on multiple trader viewpoints, breaking decisively above 320 could change short-term bias.
c) According to etMoney, RSI on weekly is not overly strong; momentum is somewhat neutral-to-down.
3. Chart Patterns / Candlestick Signal
a) Some traders point to a bearish engulfing pattern on the weekly.
b) If the weekly closes below ~₹320 with this pattern, the bearish case gains strength (according to those traders).
c) On the flip side, if 320 holds and price bounces, we might see a retracement or consolidation rather than a full breakdown.
4. Valuation Risk / Fundamental Pressure
a) Eternal’s valuation is very rich: its P/E is extremely high, which concerns some market participants.
b) On the fundamental side: strong revenue growth is being driven by Blinkit (quick commerce), but profit pressures remain.
c) According to a report, losses might have peaked, but execution risk remains.
I built a Buy & Sell Signal Indicator with 85% accuracy.
📈 Get access via DM or
WhatsApp: wa.link/d997q0
Contact - +91 76782 40962
| Email: techncialexpress@gmail.com
| Script Coder | Trader | Investor | From India
📈 Get access via DM or
WhatsApp: wa.link/d997q0
Contact - +91 76782 40962
| Email: techncialexpress@gmail.com
| Script Coder | Trader | Investor | From India
Bài đăng liên quan
Thông báo miễn trừ trách nhiệm
Thông tin và các ấn phẩm này không nhằm mục đích, và không cấu thành, lời khuyên hoặc khuyến nghị về tài chính, đầu tư, giao dịch hay các loại khác do TradingView cung cấp hoặc xác nhận. Đọc thêm tại Điều khoản Sử dụng.