Pair: ETH Market Cap Dominance (%)
Timeframe: 3D
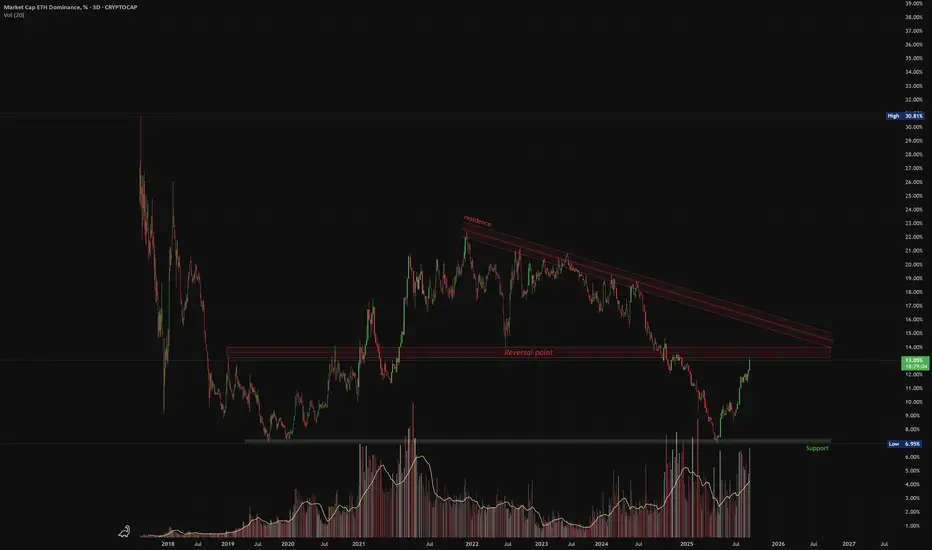
Structure: Descending Trendline + Horizontal Resistance
Volume: Rising on approach to resistance
📉 What’s happening?
ETH dominance has rallied from support and is now approaching a historically strong resistance zone marked by multiple rejection points. Price is also near the long-term descending trendline, which has acted as a ceiling for over a year.
🔻 Caution Zone:
Resistance between 18.5%–19.2%
Historical reversal area (marked as “Reversal Point”)
📌 Pullback Triggers:
Bearish candle formation at resistance
Declining volume on further push up
Failure to close above the descending trendline
Bias: Short-term pullback likely unless ETH dominance breaks and closes above resistance with strong volume.
Timeframe: 3D
Structure: Descending Trendline + Horizontal Resistance
Volume: Rising on approach to resistance
📉 What’s happening?
ETH dominance has rallied from support and is now approaching a historically strong resistance zone marked by multiple rejection points. Price is also near the long-term descending trendline, which has acted as a ceiling for over a year.
🔻 Caution Zone:
Resistance between 18.5%–19.2%
Historical reversal area (marked as “Reversal Point”)
📌 Pullback Triggers:
Bearish candle formation at resistance
Declining volume on further push up
Failure to close above the descending trendline
Bias: Short-term pullback likely unless ETH dominance breaks and closes above resistance with strong volume.
VM
Thông báo miễn trừ trách nhiệm
Thông tin và ấn phẩm không có nghĩa là và không cấu thành, tài chính, đầu tư, kinh doanh, hoặc các loại lời khuyên hoặc khuyến nghị khác được cung cấp hoặc xác nhận bởi TradingView. Đọc thêm trong Điều khoản sử dụng.
Thông báo miễn trừ trách nhiệm
Thông tin và ấn phẩm không có nghĩa là và không cấu thành, tài chính, đầu tư, kinh doanh, hoặc các loại lời khuyên hoặc khuyến nghị khác được cung cấp hoặc xác nhận bởi TradingView. Đọc thêm trong Điều khoản sử dụng.