Ether Futures (ETH) continue to tell a story of controlled pressure — one that traders have seen before across many markets, but rarely with this level of composure. The selling has been persistent, yet measured, and despite the depth of the decline, Ether has remained remarkably disciplined within its volatility structure. In short, price is walking the lower Bollinger Band — and doing it with intent.
The Market’s Controlled Descent
When an asset walks the lower Bollinger Band, it signals a market under steady directional momentum. The band represents volatility boundaries built around a moving average; hugging its lower edge reflects consistent downside force without capitulation. In Ether’s case, the message is clear — bears are in charge, but not panicking.
This pattern of orderly decline can be deceptive. It often convinces traders that “it can’t go lower” simply because volatility seems contained. Yet, in technical behavior, containment isn’t comfort — it’s momentum management. Until the market detaches from the band and closes above the midline, downside potential remains valid.
The Downside Magnet — UFO Support at 1883.0
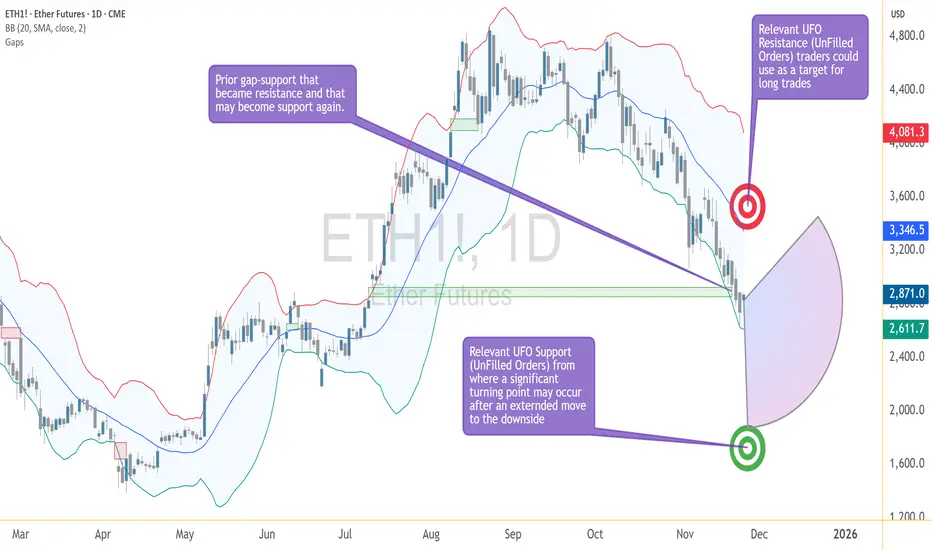
Beneath the current price structure lies a level of particular interest: 1883.0. This is not just another number on the chart; it marks a UFO (UnFilled Orders) zone — an area where unexecuted buy orders from prior trading sessions may still be sitting.
Such levels often act as demand magnets. Price gravitates toward them as liquidity seeks to rebalance. If ETH continues its gradual descent, 1883.0 could act as a “final test” of demand strength. Traders currently short may view this area as a logical place to take profits or reduce exposure, while contrarian participants might monitor it for early signs of stabilization.
Walking the Edge — Bollinger Band Dynamics
The Bollinger Band is more than a volatility envelope; it’s a behavioral tool. Price hugging the lower band isn’t a reversal signal on its own. It shows persistent imbalance — sellers are comfortable pressing until they meet true counterflow demand.
The key observation isn’t where Ether trades, but how it interacts with the band:
At present, Ether remains on the outer lane — still walking the edge, with no confirmed volatility squeeze yet in play.
The Reversal Trigger — The Gap Between 2853.5–2769.0
Ether’s chart carries memory — and that memory is marked by the closure of a previously open gap between 2853.5 and 2769.0. Gaps represent unbalanced zones where the market skipped transactions, often leaving behind psychological resistance.
As long as ETH remains below 2769.0, bearish pressure dominates. A decisive close through the 2853.5 boundary would, however, suggest sellers have lost control. That event could flip the zone from resistance to support — the technical definition of a reversal confirmation.
Until that happens, Ether continues to operate in a bearish environment within its Bollinger framework, respecting lower boundaries and testing demand without capitulation.
The Upside Magnet — UFO Resistance at 3376.5
If the market does achieve a confirmed reversal through the gap zone, the next structural target stands near 3376.5. This region contains a UFO resistance cluster, where unfilled sell orders may wait to re-engage.
This becomes the “upside magnet” in the event of a bullish shift. Not as a forecast, but as a conditional marker — if price proves it can break through 2853.5, the 3376.5 zone becomes the next logical test for momentum sustainability.
Case Study: Risk Structure and Trade Framing
The beauty of futures markets lies in flexibility. Traders can define clear structural zones, build conditional scenarios, and design reward-to-risk ratios before any entry occurs. Ether’s chart currently offers two educational case studies:
Scenario 1 — Continuation Setup
If ETH continues trading below 2769.0, the bearish structure remains intact. Traders could study how price behaves as it approaches 1883.0 to understand profit-taking dynamics or potential trend exhaustion.
Scenario 2 — Reversal Setup
If ETH breaks and closes above 2853.5, the tone changes. It implies the market has absorbed overhead supply, opening the path toward 3376.5. In this case, risk would typically be defined below the reclaimed gap zone, maintaining a controlled risk ratio.
Whichever scenario unfolds, the discipline lies not in prediction but in preparation — in defining “if this, then that” logic.
Contract Specifications
To understand how traders express these views, it helps to revisit how Ether Futures work on CME.
Ether Futures (ETH)
For traders seeking smaller capital exposure, CME also lists Micro Ether Futures (MET) — 1/500th the size of the standard contract. This smaller format offers precision for testing setups, scaling positions, or managing margin during high volatility periods. Importantly, both ETH and MET track the same underlying price behavior, allowing consistent technical interpretation across sizes.
Managing Risk — Beyond Price Targets
Regardless of contract size, effective futures trading is a balance between conviction and constraint. Every trade requires three coordinates before execution:
A well-structured plan incorporates all three. For instance, a trader eyeing ETH’s move toward 1883.0 should define exit conditions before entry — not after volatility spikes. The same logic applies if Ether were to reclaim 2853.5 and aim higher; stop placement must be systematic, not spontaneous.
Ether Futures in Market Context
Ether’s futures market has become one of the clearest barometers of institutional sentiment in crypto. It reflects not retail enthusiasm but structured positioning, hedging, and liquidity management. The current price behavior — a slow, calculated descent — signals strategic repositioning rather than panic liquidation.
This distinction matters. Markets driven by liquidation collapse violently and rebound sharply. Markets driven by reallocation, like the current Ether environment, tend to evolve gradually — a series of tests, pauses, and measured reactions. Recognizing this tempo helps traders align their strategies with the rhythm of institutional order flow.
Summary — The Market Still Walking the Edge
Ether’s structure can be summarized in three key technical zones:
As long as Ether remains below the gap zone, momentum remains under bearish control. If it trades through and holds above, a structural shift may begin. Until then, the market keeps “walking the edge” — respecting volatility, testing support, and waiting for conviction.
When charting futures, the data provided could be delayed. Traders working with the ticker symbols discussed in this idea may prefer to use CME Group real-time data plan on TradingView: tradingview.com/cme/ - This consideration is particularly important for shorter-term traders, whereas it may be less critical for those focused on longer-term trading strategies.
General Disclaimer:
The trade ideas presented herein are solely for illustrative purposes forming a part of a case study intended to demonstrate key principles in risk management within the context of the specific market scenarios discussed. These ideas are not to be interpreted as investment recommendations or financial advice. They do not endorse or promote any specific trading strategies, financial products, or services. The information provided is based on data believed to be reliable; however, its accuracy or completeness cannot be guaranteed. Trading in financial markets involves risks, including the potential loss of principal. Each individual should conduct their own research and consult with professional financial advisors before making any investment decisions. The author or publisher of this content bears no responsibility for any actions taken based on the information provided or for any resultant financial or other losses.
The Market’s Controlled Descent
When an asset walks the lower Bollinger Band, it signals a market under steady directional momentum. The band represents volatility boundaries built around a moving average; hugging its lower edge reflects consistent downside force without capitulation. In Ether’s case, the message is clear — bears are in charge, but not panicking.
This pattern of orderly decline can be deceptive. It often convinces traders that “it can’t go lower” simply because volatility seems contained. Yet, in technical behavior, containment isn’t comfort — it’s momentum management. Until the market detaches from the band and closes above the midline, downside potential remains valid.
The Downside Magnet — UFO Support at 1883.0
Beneath the current price structure lies a level of particular interest: 1883.0. This is not just another number on the chart; it marks a UFO (UnFilled Orders) zone — an area where unexecuted buy orders from prior trading sessions may still be sitting.
Such levels often act as demand magnets. Price gravitates toward them as liquidity seeks to rebalance. If ETH continues its gradual descent, 1883.0 could act as a “final test” of demand strength. Traders currently short may view this area as a logical place to take profits or reduce exposure, while contrarian participants might monitor it for early signs of stabilization.
Walking the Edge — Bollinger Band Dynamics
The Bollinger Band is more than a volatility envelope; it’s a behavioral tool. Price hugging the lower band isn’t a reversal signal on its own. It shows persistent imbalance — sellers are comfortable pressing until they meet true counterflow demand.
The key observation isn’t where Ether trades, but how it interacts with the band:
- If the band widens while Ether stays glued to its edge, volatility expansion favors continuation.
- If the band narrows and Ether starts oscillating away from it, compression signals the potential for reversal.
At present, Ether remains on the outer lane — still walking the edge, with no confirmed volatility squeeze yet in play.
The Reversal Trigger — The Gap Between 2853.5–2769.0
Ether’s chart carries memory — and that memory is marked by the closure of a previously open gap between 2853.5 and 2769.0. Gaps represent unbalanced zones where the market skipped transactions, often leaving behind psychological resistance.
As long as ETH remains below 2769.0, bearish pressure dominates. A decisive close through the 2853.5 boundary would, however, suggest sellers have lost control. That event could flip the zone from resistance to support — the technical definition of a reversal confirmation.
Until that happens, Ether continues to operate in a bearish environment within its Bollinger framework, respecting lower boundaries and testing demand without capitulation.
The Upside Magnet — UFO Resistance at 3376.5
If the market does achieve a confirmed reversal through the gap zone, the next structural target stands near 3376.5. This region contains a UFO resistance cluster, where unfilled sell orders may wait to re-engage.
This becomes the “upside magnet” in the event of a bullish shift. Not as a forecast, but as a conditional marker — if price proves it can break through 2853.5, the 3376.5 zone becomes the next logical test for momentum sustainability.
Case Study: Risk Structure and Trade Framing
The beauty of futures markets lies in flexibility. Traders can define clear structural zones, build conditional scenarios, and design reward-to-risk ratios before any entry occurs. Ether’s chart currently offers two educational case studies:
Scenario 1 — Continuation Setup
If ETH continues trading below 2769.0, the bearish structure remains intact. Traders could study how price behaves as it approaches 1883.0 to understand profit-taking dynamics or potential trend exhaustion.
Scenario 2 — Reversal Setup
If ETH breaks and closes above 2853.5, the tone changes. It implies the market has absorbed overhead supply, opening the path toward 3376.5. In this case, risk would typically be defined below the reclaimed gap zone, maintaining a controlled risk ratio.
Whichever scenario unfolds, the discipline lies not in prediction but in preparation — in defining “if this, then that” logic.
Contract Specifications
To understand how traders express these views, it helps to revisit how Ether Futures work on CME.
Ether Futures (ETH)
- Contract size: 50 Ether with a minimum tick: 0.25 per Ether = $25 per contract
- Trading hours: Nearly 24 hours a day, Sunday to Friday, on CME Globex
- Margin requirement: approximately $44,000 per contract (subject to changes)
For traders seeking smaller capital exposure, CME also lists Micro Ether Futures (MET) — 1/500th the size of the standard contract. This smaller format offers precision for testing setups, scaling positions, or managing margin during high volatility periods. Importantly, both ETH and MET track the same underlying price behavior, allowing consistent technical interpretation across sizes.
Managing Risk — Beyond Price Targets
Regardless of contract size, effective futures trading is a balance between conviction and constraint. Every trade requires three coordinates before execution:
- Entry — based on objective price structure or confirmation.
- Exit — determined by invalidation, not emotion.
- Size — calibrated to volatility and margin.
A well-structured plan incorporates all three. For instance, a trader eyeing ETH’s move toward 1883.0 should define exit conditions before entry — not after volatility spikes. The same logic applies if Ether were to reclaim 2853.5 and aim higher; stop placement must be systematic, not spontaneous.
Ether Futures in Market Context
Ether’s futures market has become one of the clearest barometers of institutional sentiment in crypto. It reflects not retail enthusiasm but structured positioning, hedging, and liquidity management. The current price behavior — a slow, calculated descent — signals strategic repositioning rather than panic liquidation.
This distinction matters. Markets driven by liquidation collapse violently and rebound sharply. Markets driven by reallocation, like the current Ether environment, tend to evolve gradually — a series of tests, pauses, and measured reactions. Recognizing this tempo helps traders align their strategies with the rhythm of institutional order flow.
Summary — The Market Still Walking the Edge
Ether’s structure can be summarized in three key technical zones:
- 1883.0: Demand magnet and potential exhaustion level.
- 2853.5–2769.0: The gap resistance band — critical reversal gate.
- 3376.5: Major resistance cluster and next test if reversal unfolds.
As long as Ether remains below the gap zone, momentum remains under bearish control. If it trades through and holds above, a structural shift may begin. Until then, the market keeps “walking the edge” — respecting volatility, testing support, and waiting for conviction.
When charting futures, the data provided could be delayed. Traders working with the ticker symbols discussed in this idea may prefer to use CME Group real-time data plan on TradingView: tradingview.com/cme/ - This consideration is particularly important for shorter-term traders, whereas it may be less critical for those focused on longer-term trading strategies.
General Disclaimer:
The trade ideas presented herein are solely for illustrative purposes forming a part of a case study intended to demonstrate key principles in risk management within the context of the specific market scenarios discussed. These ideas are not to be interpreted as investment recommendations or financial advice. They do not endorse or promote any specific trading strategies, financial products, or services. The information provided is based on data believed to be reliable; however, its accuracy or completeness cannot be guaranteed. Trading in financial markets involves risks, including the potential loss of principal. Each individual should conduct their own research and consult with professional financial advisors before making any investment decisions. The author or publisher of this content bears no responsibility for any actions taken based on the information provided or for any resultant financial or other losses.
🌟 Take This Analysis Further with Our AI Scripts 🎯 | Discover How at tradewithufos.com 🚀 Choose a Subscription: Monthly ᴼᴿ Yearly ᴼᴿ Lifetime 🗓️ | Unlock Intelligent UFO Scripts Free 💡
Bài đăng liên quan
Thông báo miễn trừ trách nhiệm
Thông tin và các ấn phẩm này không nhằm mục đích, và không cấu thành, lời khuyên hoặc khuyến nghị về tài chính, đầu tư, giao dịch hay các loại khác do TradingView cung cấp hoặc xác nhận. Đọc thêm tại Điều khoản Sử dụng.