# The Springboard Effect: ETHA's Coiled Energy Release
## Buyer Dominance Established (Points 1→3)
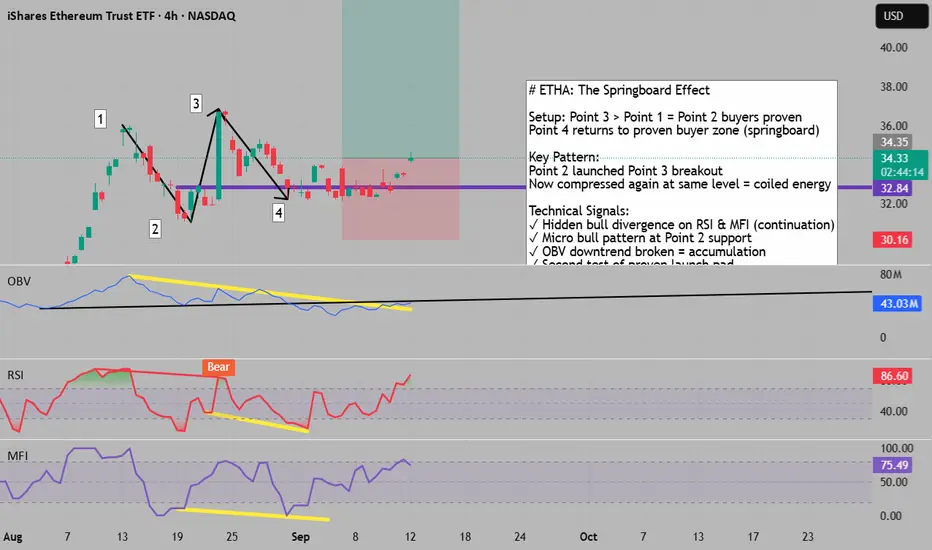
The market structure tells a compelling story: Point 3 created a higher high, decisively surpassing Point 1 sellers. This achievement transforms Point 2 into proven buyer territory - the origin point that launched Point 3's breakout. When price returns to this zone, we can expect these proven buyers to defend their stronghold.
Point 4 marks that critical return - sellers have brought price back to where buyers previously launched their assault. This sets up what I call the "Springboard Effect."
## The Springboard Mechanics
Think of Point 2 as a compressed spring. The first compression (Points 1→2) stored energy. The release (Points 2→3) proved the spring's power. Now at Point 4, we're seeing the second compression of the same spring.
What makes this powerful:
• Buyers already proved they can launch from this level
• The zone has been tested and validated
• Each test that holds adds more coiled energy
## Hidden Bullish Divergence - The Continuation Signal
• RSI: Hidden bullish divergence
• MFI: Hidden bullish divergence
Hidden bullish divergence at proven support is one of the most reliable continuation patterns. Unlike regular divergence that signals reversal, hidden divergence suggests the trend is merely pausing before continuing higher.
## The Micro Pattern Confirmation
At Point 2 support, we're seeing a micro bull pattern - a small-scale bullish formation right at the critical level. This isn't just support holding; it's buyers actively stepping in with conviction.
Micro patterns at macro levels often trigger larger moves as they:
• Confirm buyer presence
• Provide early entry signals
• Show immediate rejection of lower prices
## OBV Breakout - The Volume Story
The OBV downtrend line has been broken, revealing a crucial shift in volume dynamics. While price pulled back to Point 2, volume structure turned bullish - suggesting accumulation during the decline. This divergence between price action and volume flow often precedes explosive moves.
## The Confluence Stack
**Bullish Factors Aligning:**
• Structure: Higher high established, returning to proven support
• Divergence: Hidden bullish on both oscillators
• Pattern: Micro bull formation at macro support
• Volume: OBV breakout showing accumulation
• Psychology: Buyers defending their breakout origin
## Risk Management Protocol
Entry: Current levels (34.35) with micro pattern confirmation
Stop Loss: 30.16 (12.20% risk) - Below Point 2 support
Target: 39.36 minimum (Chaos Theory level) - aiming for 1:5 R:R
Risk/Reward Analysis:
• Risk: 4.19 points (12.20%)
• Minimum Target: 5.01 points (14.58%) = 1.2:1
• For 1:5 R:R: Need 20.95 points up = 55.30 target
Position Advantages:
• Proven support providing clear risk definition
• Multiple confirmations reducing false signal risk
• Trend continuation setup (lower risk than reversal)
• Chaos Theory indicator suggests 39.36 as mathematical target
## The Narrative Arc
ETHA's journey from Points 1→4 shows classic accumulation and markup phases:
1. Accumulation: Points 1-2 (buyers building positions)
2. Markup: Points 2-3 (breakout proves buyer strength)
3. Re-accumulation: Points 3-4 (pullback to reload)
4. Next Markup: Potential launch from Point 4
This is textbook Wyckoff theory in action - a pullback to the "creek" before the next surge.
---
Key Insight: When price returns to a level that previously launched a breakout, with hidden divergence confirming trend continuation and volume structure turning bullish, you're witnessing a high-probability springboard setup. The coiled energy from multiple successful defenses often leads to explosive moves higher.
## Buyer Dominance Established (Points 1→3)
The market structure tells a compelling story: Point 3 created a higher high, decisively surpassing Point 1 sellers. This achievement transforms Point 2 into proven buyer territory - the origin point that launched Point 3's breakout. When price returns to this zone, we can expect these proven buyers to defend their stronghold.
Point 4 marks that critical return - sellers have brought price back to where buyers previously launched their assault. This sets up what I call the "Springboard Effect."
## The Springboard Mechanics
Think of Point 2 as a compressed spring. The first compression (Points 1→2) stored energy. The release (Points 2→3) proved the spring's power. Now at Point 4, we're seeing the second compression of the same spring.
What makes this powerful:
• Buyers already proved they can launch from this level
• The zone has been tested and validated
• Each test that holds adds more coiled energy
## Hidden Bullish Divergence - The Continuation Signal
• RSI: Hidden bullish divergence
• MFI: Hidden bullish divergence
Hidden bullish divergence at proven support is one of the most reliable continuation patterns. Unlike regular divergence that signals reversal, hidden divergence suggests the trend is merely pausing before continuing higher.
## The Micro Pattern Confirmation
At Point 2 support, we're seeing a micro bull pattern - a small-scale bullish formation right at the critical level. This isn't just support holding; it's buyers actively stepping in with conviction.
Micro patterns at macro levels often trigger larger moves as they:
• Confirm buyer presence
• Provide early entry signals
• Show immediate rejection of lower prices
## OBV Breakout - The Volume Story
The OBV downtrend line has been broken, revealing a crucial shift in volume dynamics. While price pulled back to Point 2, volume structure turned bullish - suggesting accumulation during the decline. This divergence between price action and volume flow often precedes explosive moves.
## The Confluence Stack
**Bullish Factors Aligning:**
• Structure: Higher high established, returning to proven support
• Divergence: Hidden bullish on both oscillators
• Pattern: Micro bull formation at macro support
• Volume: OBV breakout showing accumulation
• Psychology: Buyers defending their breakout origin
## Risk Management Protocol
Entry: Current levels (34.35) with micro pattern confirmation
Stop Loss: 30.16 (12.20% risk) - Below Point 2 support
Target: 39.36 minimum (Chaos Theory level) - aiming for 1:5 R:R
Risk/Reward Analysis:
• Risk: 4.19 points (12.20%)
• Minimum Target: 5.01 points (14.58%) = 1.2:1
• For 1:5 R:R: Need 20.95 points up = 55.30 target
Position Advantages:
• Proven support providing clear risk definition
• Multiple confirmations reducing false signal risk
• Trend continuation setup (lower risk than reversal)
• Chaos Theory indicator suggests 39.36 as mathematical target
## The Narrative Arc
ETHA's journey from Points 1→4 shows classic accumulation and markup phases:
1. Accumulation: Points 1-2 (buyers building positions)
2. Markup: Points 2-3 (breakout proves buyer strength)
3. Re-accumulation: Points 3-4 (pullback to reload)
4. Next Markup: Potential launch from Point 4
This is textbook Wyckoff theory in action - a pullback to the "creek" before the next surge.
---
Key Insight: When price returns to a level that previously launched a breakout, with hidden divergence confirming trend continuation and volume structure turning bullish, you're witnessing a high-probability springboard setup. The coiled energy from multiple successful defenses often leads to explosive moves higher.
Join free public community -> t.me/+ad-OZdmZq7M3MTg1
Thông báo miễn trừ trách nhiệm
Thông tin và ấn phẩm không có nghĩa là và không cấu thành, tài chính, đầu tư, kinh doanh, hoặc các loại lời khuyên hoặc khuyến nghị khác được cung cấp hoặc xác nhận bởi TradingView. Đọc thêm trong Điều khoản sử dụng.