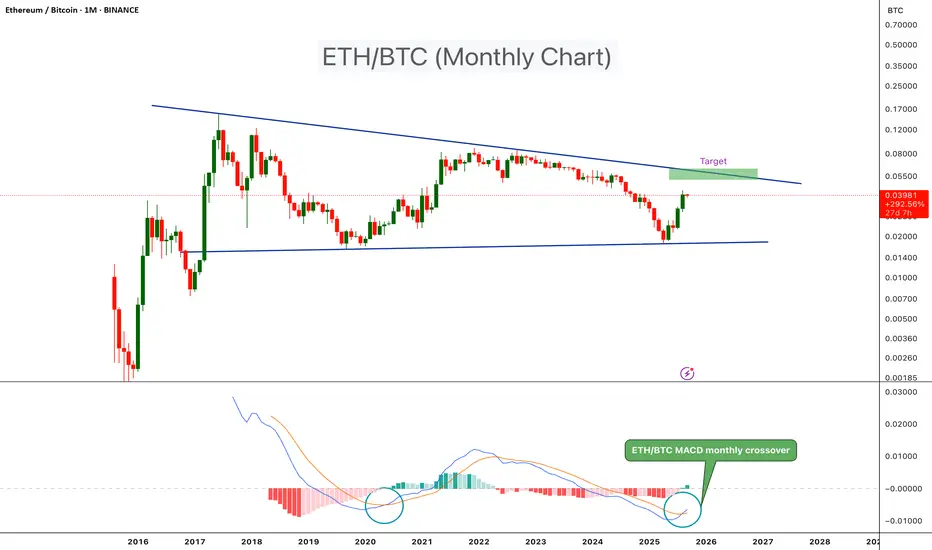
ETH/BTC pair is trading within a long-term triangle pattern. A few months ago, price bottomed out at the triangle support and has since bounced, with the pair now trading around the 0.039 level.
On the monthly timeframe, a bullish MACD crossover has just appeared. This is a strong signal that ETH could start outperforming BTC in the near term. The last time a similar crossover occurred was in June 2020, which was followed by a powerful rally in ETH.
Looking ahead, the next major resistance for ETH/BTC is near the 0.060 level. If bullish momentum continues, price could test this zone in the coming months. This resistance area may also act as the potential peak for ETH in this bull run cycle.
🚀Telegram : t.me/hexatrades
🌐Website: hexatrades.io/
🗣️Twitter(X): twitter.com/HexaTrades
🌐Website: hexatrades.io/
🗣️Twitter(X): twitter.com/HexaTrades
Bài đăng liên quan
Thông báo miễn trừ trách nhiệm
Thông tin và các ấn phẩm này không nhằm mục đích, và không cấu thành, lời khuyên hoặc khuyến nghị về tài chính, đầu tư, giao dịch hay các loại khác do TradingView cung cấp hoặc xác nhận. Đọc thêm tại Điều khoản Sử dụng.