If you’ve been tracking Ethereum on the daily chart, the structure is starting to look heavy — and not in a bullish way. Let’s break this down step by step so it’s easy to follow 👇
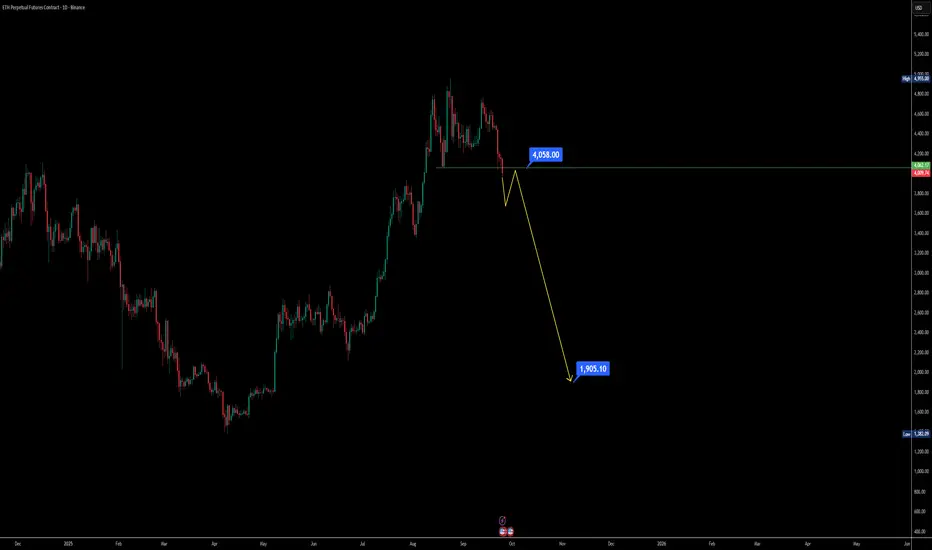
Support lost: ETH has already broken its key support zone around $4060, which previously acted as a higher low. Now, the recent dip is printing a new lower low, shifting market sentiment.
Daily close levels matter: If the daily candle closes below $4000, it confirms weakness and opens doors for a further sell-off.
Possible head and shoulders: A pullback toward the $4100 region could simply build the right shoulder of a bearish head and shoulder pattern. The structure matches what we saw earlier on the left shoulder.
Bearish momentum risk: If ETH fails to hold above $4000 after that pullback, we could be looking at extended downside — even a sharp fall toward the $2000 zone based on historical dump patterns.
Market behavior reminder: Over the past two years, whenever ETH started a distribution breakdown, the drop was often fast and violent. That’s why caution is key here.
📌 Key Takeaway: Ethereum is at a make-or-break daily level. Watch $4000 closely — losing this level could accelerate a bearish breakdown. Short-term traders may look for opportunities on the pullback, while long-term holders need to stay cautious of the possible head and shoulders pattern forming.
FOLLOW MY TELEGRAM CHANNEL FOR FREE : bit.ly/3JfrpgV
Thông báo miễn trừ trách nhiệm
Thông tin và các ấn phẩm này không nhằm mục đích, và không cấu thành, lời khuyên hoặc khuyến nghị về tài chính, đầu tư, giao dịch hay các loại khác do TradingView cung cấp hoặc xác nhận. Đọc thêm tại Điều khoản Sử dụng.