Based on the recent pivot formations, momentum, and wave degrees, we are observing signs of a deeper correction on the Ethereum chart, which we find necessary to warn about.
As you know, we follow technical evidence and signals to provide analysis—we do not predict the market but rather analyze it step by step.
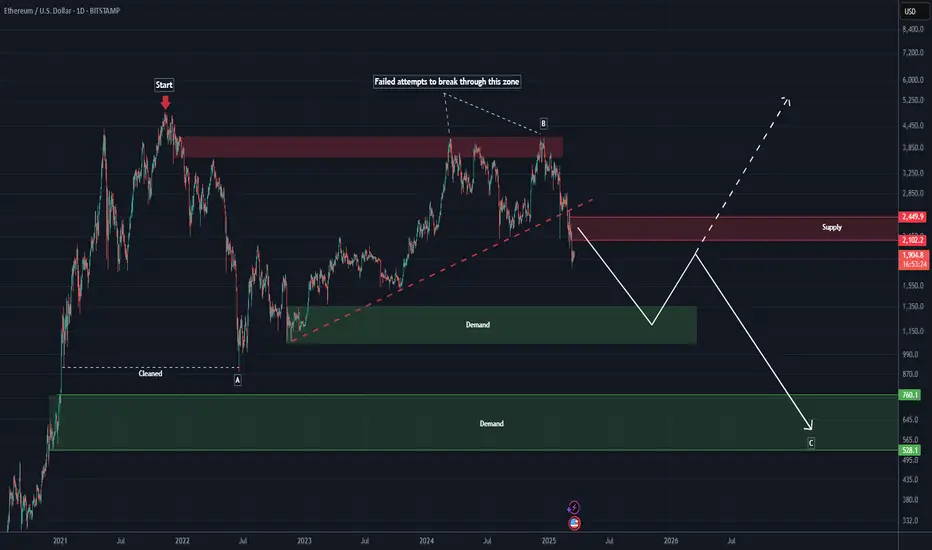
From the point where we placed the red arrow on the chart, Ethereum's price-time correction has begun.
It appears that an ABC pattern is forming, with wave B now completed or nearing completion after losing the trendline (red dashed line).
Wave C should align with the previous waves in degree and have a longer duration than wave A.
Since wave B retraced close to the top of wave A, wave C’s price correction may not fall too far below the low of wave A.
We have two possible scenarios: either Demand 1 will be the market bottom, or Demand 2.
A daily candle closing above the invalidation level would invalidate this analysis. Let's see how it plays out.
invalidation level : 2941$
For risk management, please don't forget stop loss and capital management
When we reach the first target, save some profit and then change the stop to entry
Comment if you have any questions
Thank You
As you know, we follow technical evidence and signals to provide analysis—we do not predict the market but rather analyze it step by step.
From the point where we placed the red arrow on the chart, Ethereum's price-time correction has begun.
It appears that an ABC pattern is forming, with wave B now completed or nearing completion after losing the trendline (red dashed line).
Wave C should align with the previous waves in degree and have a longer duration than wave A.
Since wave B retraced close to the top of wave A, wave C’s price correction may not fall too far below the low of wave A.
We have two possible scenarios: either Demand 1 will be the market bottom, or Demand 2.
A daily candle closing above the invalidation level would invalidate this analysis. Let's see how it plays out.
invalidation level : 2941$
For risk management, please don't forget stop loss and capital management
When we reach the first target, save some profit and then change the stop to entry
Comment if you have any questions
Thank You
Giao dịch đang hoạt động
After hitting the red zone, it dropped more than 33% . The price can find support from the green zone.🔆To succeed in trading, just enter our Telegram channel:
Free membership: t.me/Behdark_EN
🔷Our Telegram channel has daily spot and futures signals 👉 t.me/Behdark_EN
💎 Exclusive signals are only shared on our Telegram channel
Free membership: t.me/Behdark_EN
🔷Our Telegram channel has daily spot and futures signals 👉 t.me/Behdark_EN
💎 Exclusive signals are only shared on our Telegram channel
Thông báo miễn trừ trách nhiệm
Thông tin và ấn phẩm không có nghĩa là và không cấu thành, tài chính, đầu tư, kinh doanh, hoặc các loại lời khuyên hoặc khuyến nghị khác được cung cấp hoặc xác nhận bởi TradingView. Đọc thêm trong Điều khoản sử dụng.
🔆To succeed in trading, just enter our Telegram channel:
Free membership: t.me/Behdark_EN
🔷Our Telegram channel has daily spot and futures signals 👉 t.me/Behdark_EN
💎 Exclusive signals are only shared on our Telegram channel
Free membership: t.me/Behdark_EN
🔷Our Telegram channel has daily spot and futures signals 👉 t.me/Behdark_EN
💎 Exclusive signals are only shared on our Telegram channel
Thông báo miễn trừ trách nhiệm
Thông tin và ấn phẩm không có nghĩa là và không cấu thành, tài chính, đầu tư, kinh doanh, hoặc các loại lời khuyên hoặc khuyến nghị khác được cung cấp hoặc xác nhận bởi TradingView. Đọc thêm trong Điều khoản sử dụng.