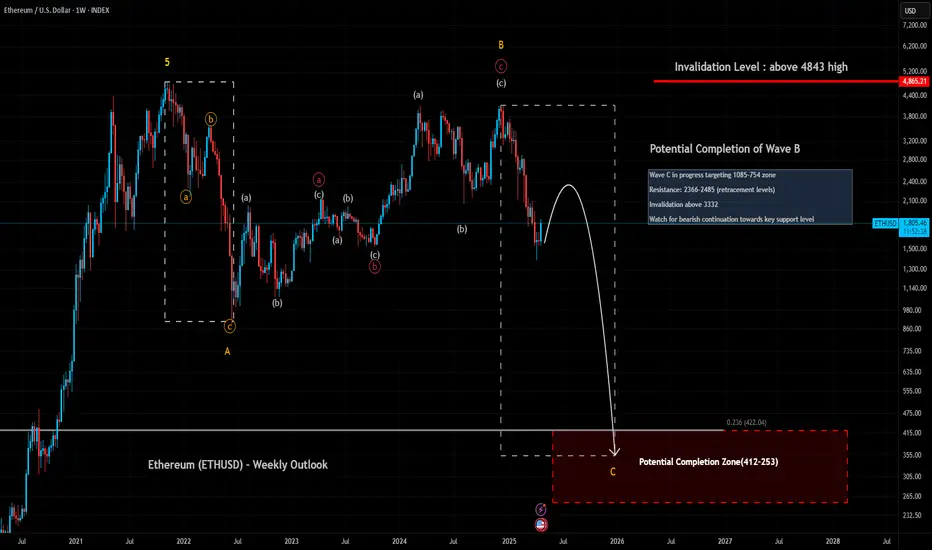
On the weekly chart, Ethereum appears to have completed a corrective Wave B inside the larger flat structure.
We are now monitoring the beginning stages of Wave C downward, following the major B top.
Immediate resistance levels are seen around $2366 and $2485 zones (0.5 and 0.618 retracement).
Key support is aligned with the $1085 level as the first major zone.
📈 For a broader context, please refer to my Monthly Ethereum analysis.
📉 For more tactical short-term entries, check my Daily Ethereum analysis.
#Ethereum #ETH #WeeklyChart #TechnicalAnalysis #ElliottWave #CryptoTrading #BearishScenario
Thông báo miễn trừ trách nhiệm
Thông tin và ấn phẩm không có nghĩa là và không cấu thành, tài chính, đầu tư, kinh doanh, hoặc các loại lời khuyên hoặc khuyến nghị khác được cung cấp hoặc xác nhận bởi TradingView. Đọc thêm trong Điều khoản sử dụng.
Thông báo miễn trừ trách nhiệm
Thông tin và ấn phẩm không có nghĩa là và không cấu thành, tài chính, đầu tư, kinh doanh, hoặc các loại lời khuyên hoặc khuyến nghị khác được cung cấp hoặc xác nhận bởi TradingView. Đọc thêm trong Điều khoản sử dụng.