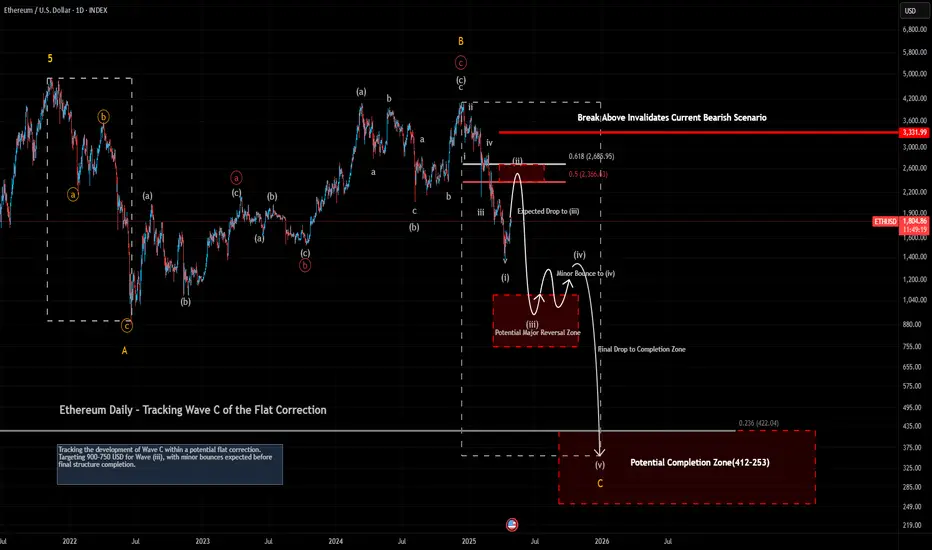
On the daily timeframe, Ethereum is unfolding within the early stages of Wave C, following the completion of a flat correction pattern.
The price has completed Wave (i) and appears to be in a corrective Wave (ii) targeting the 0.5–0.618 retracement zones (around $2366 to $2485).
Upon completion of Wave (ii), a sharp Wave (iii) decline towards the 1085–754 zone is expected.
📈 For a bigger picture, please refer to my Weekly and Monthly Ethereum analyses.
#Ethereum #ETH #DailyChart #CryptoAnalysis #TechnicalAnalysis #ElliottWave #CryptoTrading
Thông báo miễn trừ trách nhiệm
Thông tin và các ấn phẩm này không nhằm mục đích, và không cấu thành, lời khuyên hoặc khuyến nghị về tài chính, đầu tư, giao dịch hay các loại khác do TradingView cung cấp hoặc xác nhận. Đọc thêm tại Điều khoản Sử dụng.
Thông báo miễn trừ trách nhiệm
Thông tin và các ấn phẩm này không nhằm mục đích, và không cấu thành, lời khuyên hoặc khuyến nghị về tài chính, đầu tư, giao dịch hay các loại khác do TradingView cung cấp hoặc xác nhận. Đọc thêm tại Điều khoản Sử dụng.