I thought this may help.
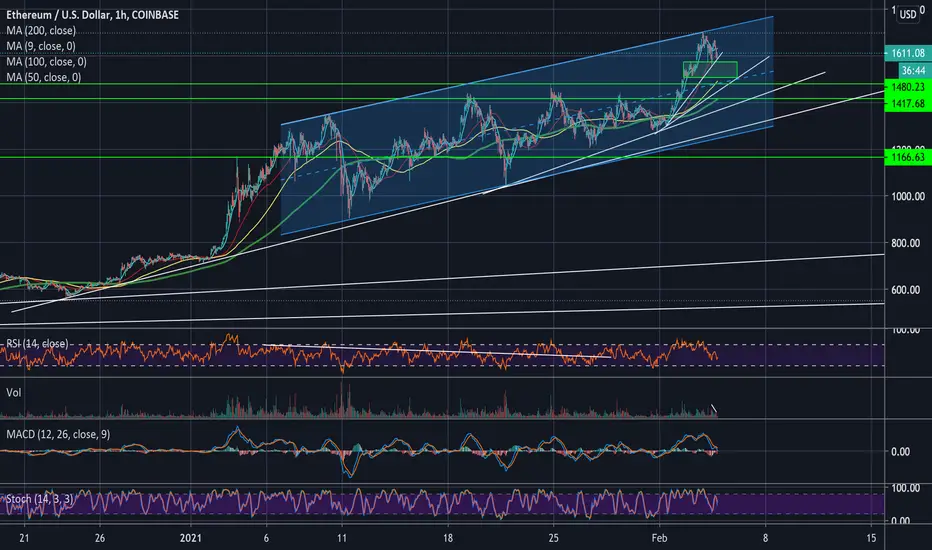
Parallel Ethereum up channel shown, while price remains above the "control line" dotted blue centre line, bulls are in charge, as per classical technical analysis. If price moves below control line, bears have more control. Bulls firmly in control here. Trade positioning is dip buying and holding.
Green lines and zones are support. Stop losses can be placed accordingly depending on the timeframe your trading in.
Please also see post here and yesterday on my page showing biases towards current parabolic move (weekly timeframe) on ETH to $3000.
Giao dịch đang hoạt động
Add to eth longsThông báo miễn trừ trách nhiệm
Thông tin và ấn phẩm không có nghĩa là và không cấu thành, tài chính, đầu tư, kinh doanh, hoặc các loại lời khuyên hoặc khuyến nghị khác được cung cấp hoặc xác nhận bởi TradingView. Đọc thêm trong Điều khoản sử dụng.
Thông báo miễn trừ trách nhiệm
Thông tin và ấn phẩm không có nghĩa là và không cấu thành, tài chính, đầu tư, kinh doanh, hoặc các loại lời khuyên hoặc khuyến nghị khác được cung cấp hoặc xác nhận bởi TradingView. Đọc thêm trong Điều khoản sử dụng.