💀 Hey , how's it going ? Come over here — Satoshi got something for you !
⏰ We’re analyzing ETH on the 1-hour timeframe timeframe .
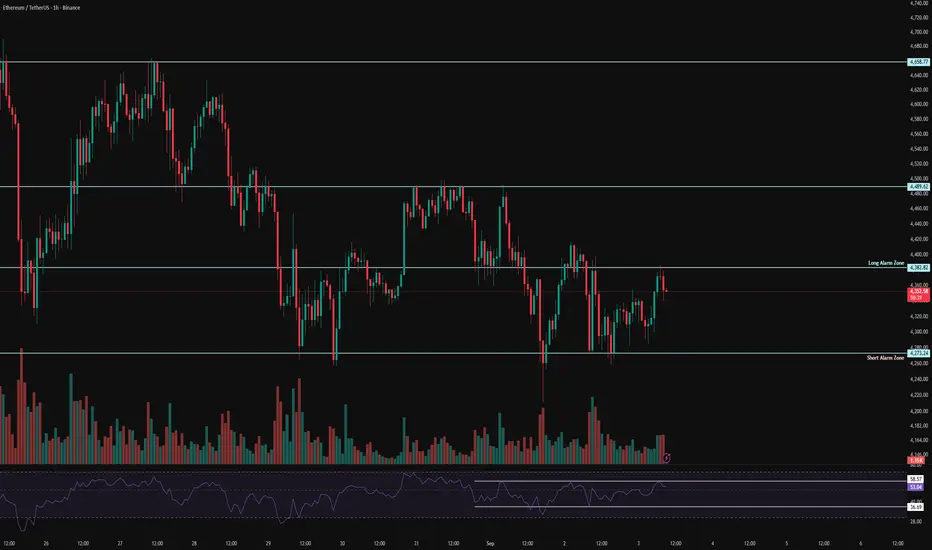
🔭 On the 1-hour timeframe of Ethereum, we can see that ETH has a similar situation to yesterday. It has an important resistance at $4382, and with a breakout and confirmation above this level, Ethereum could experience a good bullish leg. Keep in mind, according to the data we posted in the channel, yesterday people in the U.S. sold their ETH and bought Bitcoin.
⛏ Two key RSI zones for Ethereum are considered: 58 and 37. Once the oscillation limit crosses these numbers, ETH can start its move.
💰 The volume and the size of green candles in Ethereum have slightly increased, and with more volume and the filling of sell orders at the $4382 resistance, Ethereum could move upward.
 🪙💸 On the 1-hour timeframe of the ETHBTC trading pair, we can see that this pair had a resistance at 0.03909, which was successfully broken with higher volume. With a completed pullback and breakout above 0.03939, Ethereum could move upward. Note that this level is directly related to the maker buyers of this pair, and in this timeframe, it’s almost at its bottom.
🔔 Two alarm zones are considered for Ethereum: the $4382 level as our long trade alarm zone, where with a breakout and confirmation above it ETH could move higher; and the $4273 level as the short trade alarm zone, where a breakdown could give us a short position.
❤️ Disclaimer : This analysis is purely based on my personal opinion and I only trade if the stated triggers are activated .
⏰ We’re analyzing ETH on the 1-hour timeframe timeframe .
🔭 On the 1-hour timeframe of Ethereum, we can see that ETH has a similar situation to yesterday. It has an important resistance at $4382, and with a breakout and confirmation above this level, Ethereum could experience a good bullish leg. Keep in mind, according to the data we posted in the channel, yesterday people in the U.S. sold their ETH and bought Bitcoin.
⛏ Two key RSI zones for Ethereum are considered: 58 and 37. Once the oscillation limit crosses these numbers, ETH can start its move.
💰 The volume and the size of green candles in Ethereum have slightly increased, and with more volume and the filling of sell orders at the $4382 resistance, Ethereum could move upward.
🔔 Two alarm zones are considered for Ethereum: the $4382 level as our long trade alarm zone, where with a breakout and confirmation above it ETH could move higher; and the $4273 level as the short trade alarm zone, where a breakdown could give us a short position.
❤️ Disclaimer : This analysis is purely based on my personal opinion and I only trade if the stated triggers are activated .
🔥 Join the Action Now 🔥
☄️ Telegram
t.me/FireHoseReel
☄️ Trade & Earn
bitunix.com/register?inviteCode=28r21f
☄️ Telegram
t.me/FireHoseReel
☄️ Trade & Earn
bitunix.com/register?inviteCode=28r21f
Bài đăng liên quan
Thông báo miễn trừ trách nhiệm
Thông tin và các ấn phẩm này không nhằm mục đích, và không cấu thành, lời khuyên hoặc khuyến nghị về tài chính, đầu tư, giao dịch hay các loại khác do TradingView cung cấp hoặc xác nhận. Đọc thêm tại Điều khoản Sử dụng.