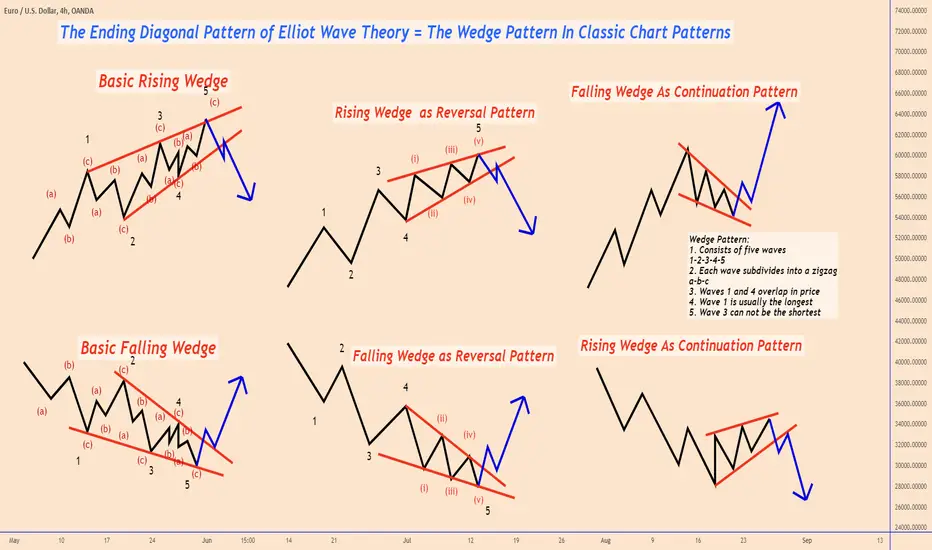
The Ending Diagonal Pattern of Elliot Wave Theory = The Wedge Pattern In Classic Chart patterns
Basic Rules For The Wedge Pattern:
1. Consists of five waves (1-2-3-4-5)
2. Each wave subdivides into a zigzag (a-b-c)
3. Waves 1 and 4 overlap in price
4. Wave 1 is usually the longest
5. Wave 3 can not be the shortest
The "Wedge Pattern" can be found as a "Reversal Pattern" or a "Continuation Pattern"
1-) A "Rising Wedge Pattern" created during an uptrend works as a "Reversal Pattern"
In this situation, the wedge pattern is mainly created during the completion of the 5th wave and on top of the wave.
This is the basic scenario of how you can find this pattern.
Once the price breaks out of the pattern, it signals that THE MAIN BULLISH TREND can change direction into BEARISH soon
or we can face a deep Bearish Correction.
2-) A "Rising Wedge Pattern" created during a downtrend works as a "Continuation Pattern"
After a strong bearish trend, the price takes a pause.
This is the moment when this pattern begins to take shape and it's a pattern that offers
a very high chance of SHORT opportunity.
Once the price breaks out of the pattern it starts to move in the direction of the MAIN BEARISH TREND.
3-) A "Falling Wedge Pattern" created during a downtrend works as a "Reversal Pattern"
In this situation, the wedge pattern is mainly created during the completion of the 5th wave and on the BOTTOM of the wave.
This is the basic scenario of how you can find this pattern.
Once the price breaks out of the pattern, it signals that THE MAIN BEARISH TREND can change direction into BULLISH soon
or we can face a deep BULLISH Correction.
4-) A "Falling Wedge Pattern" created during an uptrend works as a "Continuation Pattern"
After a strong bullish trend, the price takes a pause.
This is the moment when this pattern begins to take shape and it's a pattern that offers
a very high chance of LONG opportunity.
Once the price breaks out of the pattern it starts to move in the direction of the MAIN BULLISH TREND.
"Thumbs Up" If you found this content useful😀
Thank you and Good Luck!
Ghi chú
These patterns can be found in all chart time frames. The market has a fractal nature, so these patterns tend to repeat themselves over and over in all time frames.
✅MY FREE Signals Channel
t.me/TradingPuzzles
✅Personal Telegram
t.me/KlejdiCuni
✅Suggested News Channel
t.me/ForexNewsNavigator_Official
t.me/TradingPuzzles
✅Personal Telegram
t.me/KlejdiCuni
✅Suggested News Channel
t.me/ForexNewsNavigator_Official
Thông báo miễn trừ trách nhiệm
Thông tin và các ấn phẩm này không nhằm mục đích, và không cấu thành, lời khuyên hoặc khuyến nghị về tài chính, đầu tư, giao dịch hay các loại khác do TradingView cung cấp hoặc xác nhận. Đọc thêm tại Điều khoản Sử dụng.