Actionable Insight:
Wait for a daily close above $0.00000078 for a long entry, targeting $0.0000010. Stop-loss at $0.00000075. Avoid trading if volume doesn’t pick up.
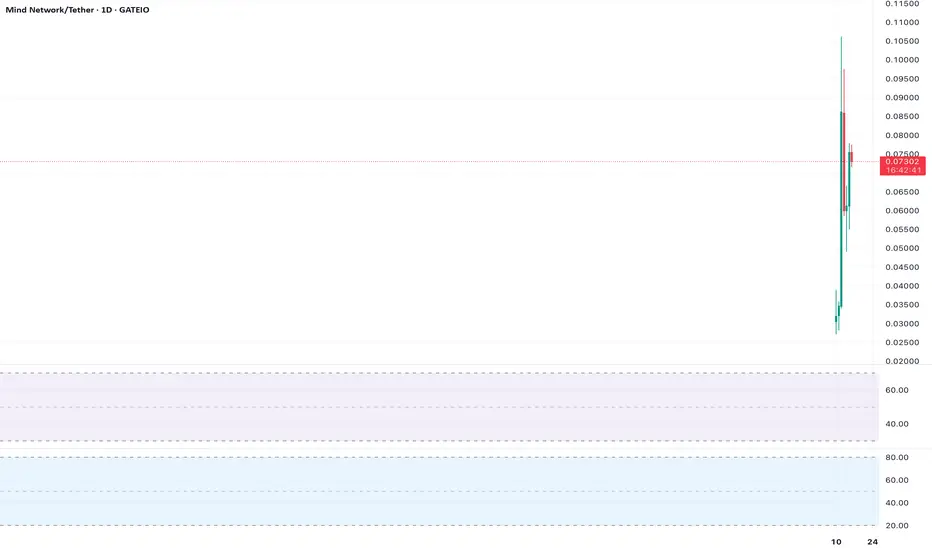
Chart Setup:
Timeframe: Daily
Indicators: 200-day EMA, RSI
Levels: Support ($0.00000078), Target ($0.0000010)
Thông báo miễn trừ trách nhiệm
Thông tin và ấn phẩm không có nghĩa là và không cấu thành, tài chính, đầu tư, kinh doanh, hoặc các loại lời khuyên hoặc khuyến nghị khác được cung cấp hoặc xác nhận bởi TradingView. Đọc thêm trong Điều khoản sử dụng.
Thông báo miễn trừ trách nhiệm
Thông tin và ấn phẩm không có nghĩa là và không cấu thành, tài chính, đầu tư, kinh doanh, hoặc các loại lời khuyên hoặc khuyến nghị khác được cung cấp hoặc xác nhận bởi TradingView. Đọc thêm trong Điều khoản sử dụng.