📊 Technical Analysis Summary – FIL/USDT
🔸 Pattern Observed:
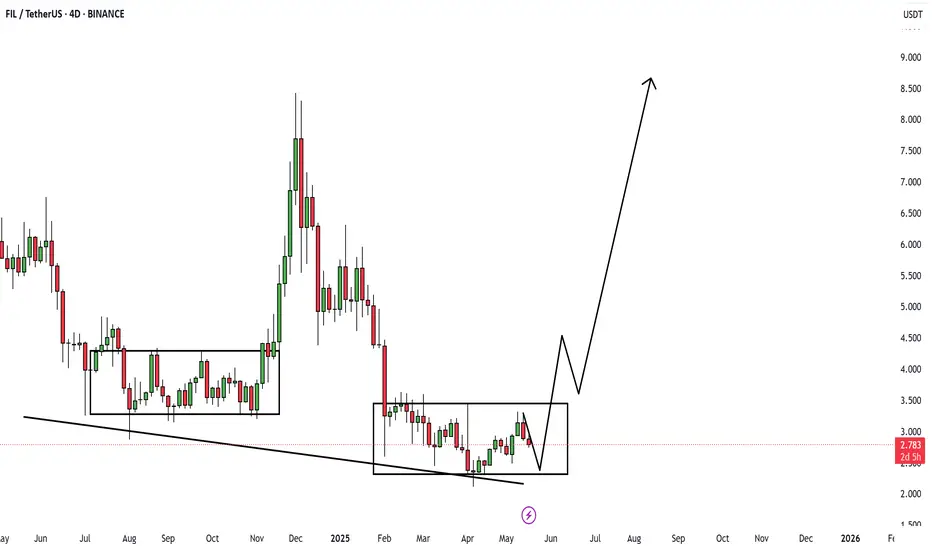
Double Accumulation Range: Two clear consolidation phases are boxed out in the chart, showing accumulation at relatively equal support zones.
Descending Support Line: The lower black trendline connects the major lows, creating a descending support structure, indicating compression and possible breakout setup.
🔸 Price Action:
Current Price: $2.787
Pullback Expected: A minor dip within the current range is possible before a breakout.
Projected Move: If this consolidation resolves bullishly, the projected target appears to be in the $8–$9 range, aligning with the black arrow on the chart.
📈 Bullish Scenario (Likely Path)
Retest support near $2.5–$2.6
Breakout trigger on move above ~$3.2–$3.4
Target zone = $8–$9 (from measured move potential)
⚠️ Key Levels to Watch
Support: $2.50 (critical zone for accumulation)
Resistance to break: ~$3.30–$3.50
Macro Target: $8.50+
✅ Conclusion:
This chart shows a potential reversal from a prolonged downtrend, where the price is forming a classic reversal structure. Patience is key—a breakout above $3.5 would confirm the bullish move.
Subscribe to my Telegram Channel 👉 :
t.me/addlist/y5mi70s3c0Y3MDQ0
Subscribe to my X 👉 : x.com/VIPROSETR
t.me/addlist/y5mi70s3c0Y3MDQ0
Subscribe to my X 👉 : x.com/VIPROSETR
Thông báo miễn trừ trách nhiệm
The information and publications are not meant to be, and do not constitute, financial, investment, trading, or other types of advice or recommendations supplied or endorsed by TradingView. Read more in the Terms of Use.