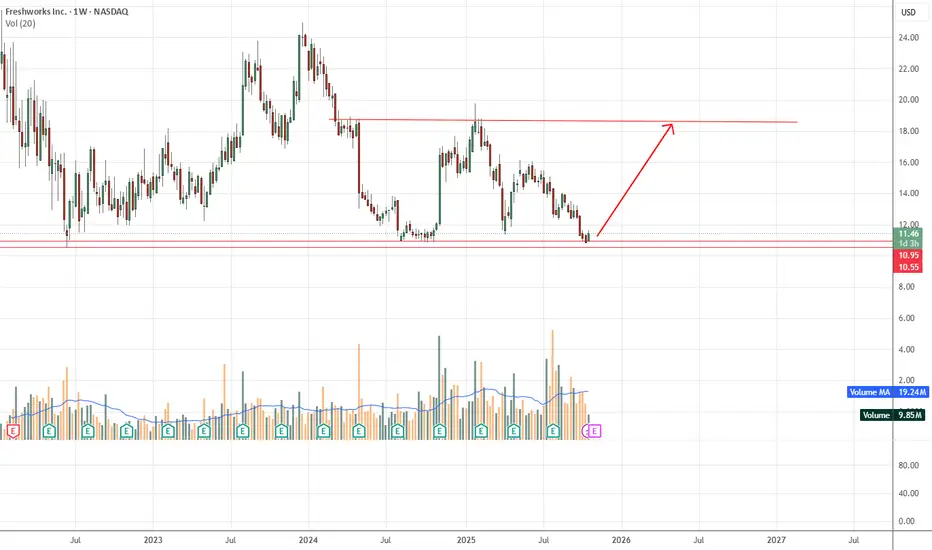
The stock is currently trading around $11.44, near its recent support zone at roughly $10.55–$10.95.
The chart shows a downtrend from previous highs, but price is testing a historically strong support level.
Resistance: Around $18 (where the upward arrow points), representing prior swing highs.
Bullish setup at current levels with clear risk/reward: low risk near support, high reward toward prior resistance.
Traders may look for confirmation (bullish candlestick, volume increase) before entering.
Giao dịch đang hoạt động
Thông báo miễn trừ trách nhiệm
Thông tin và các ấn phẩm này không nhằm mục đích, và không cấu thành, lời khuyên hoặc khuyến nghị về tài chính, đầu tư, giao dịch hay các loại khác do TradingView cung cấp hoặc xác nhận. Đọc thêm tại Điều khoản Sử dụng.
Thông báo miễn trừ trách nhiệm
Thông tin và các ấn phẩm này không nhằm mục đích, và không cấu thành, lời khuyên hoặc khuyến nghị về tài chính, đầu tư, giao dịch hay các loại khác do TradingView cung cấp hoặc xác nhận. Đọc thêm tại Điều khoản Sử dụng.