FTM is in Danger of Testing Much Lower Price Ranges
FTM chart is not looking very good in the near term.
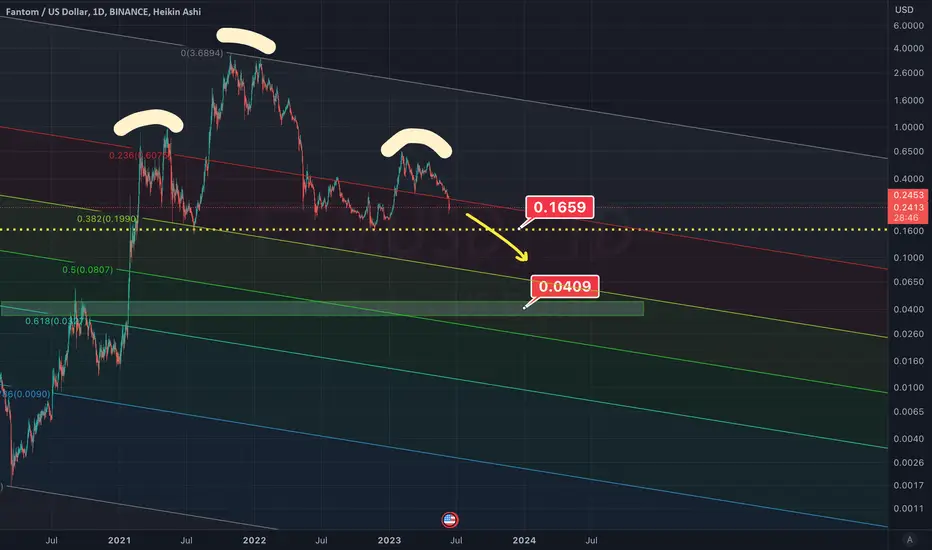
If FTM breaks below 0.20 level, it could accelerate down to 0.04 level which is aligned with the 0.618 golden pocket.
FTM is also forming a head and shoulders pattern and if it breaks the neck line of 0.1660 the price target for that is also right below 0.04.
If FTM breaks below 0.20 level, it could accelerate down to 0.04 level which is aligned with the 0.618 golden pocket.
FTM is also forming a head and shoulders pattern and if it breaks the neck line of 0.1660 the price target for that is also right below 0.04.
E.O. Breakers
@cryptowhenlambo
linktr.ee/cryptobreakers
patreon.com/CryptoWhenLambo
@cryptowhenlambo
linktr.ee/cryptobreakers
patreon.com/CryptoWhenLambo
Thông báo miễn trừ trách nhiệm
Thông tin và các ấn phẩm này không nhằm mục đích, và không cấu thành, lời khuyên hoặc khuyến nghị về tài chính, đầu tư, giao dịch hay các loại khác do TradingView cung cấp hoặc xác nhận. Đọc thêm tại Điều khoản Sử dụng.