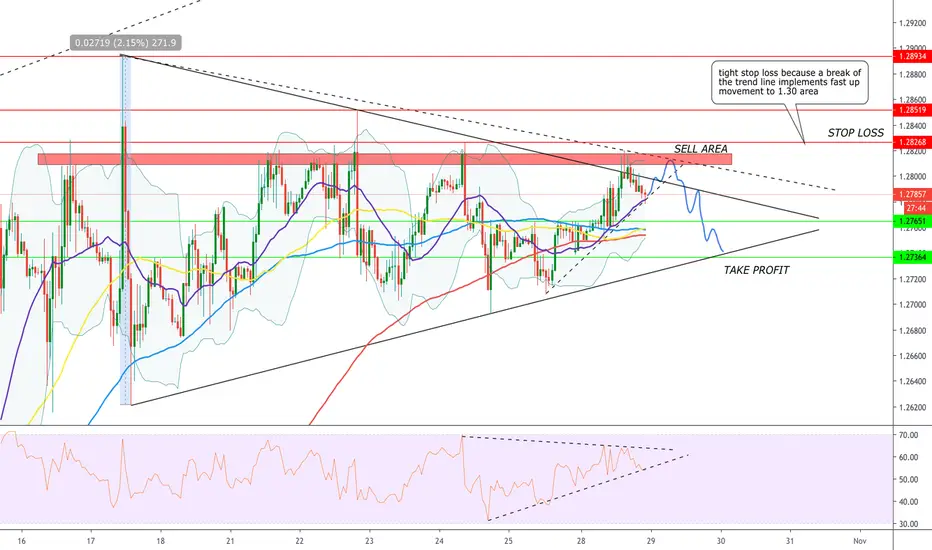
Market price moves within symmetrical triangle since middle of October and is near strong resistance area (drawn as sell area in the chart)
We will wait for a double top sell entry to trade the last down wave within this triangle.
-50 day moving average crossed 100 & 200 days which implements more up movement in short term + the 20 day moving average doesn't stopped up movement which indicates further price up movement as well
-Bollinger bands still in up movement which indicates another up movement as well
-RSI baseline is near up trend support line and need to close above it for further price up movement
In case of a fast break above the stop loss line this idea is invalid because this would be a strong buy signal.
Giao dịch đang hoạt động
short active after close under trend lineGhi chú
move stop loss to entryĐóng lệnh: đạt mục tiêu
trailing stop reached after breakout from resistance at 1,2765 - 30 pips ROIThe analyses provided are for informational purposes only and do not constitute financial advice or recommendations to buy or sell anything. The information presented is based on personal research and interpretation.
Bài đăng liên quan
Thông báo miễn trừ trách nhiệm
Thông tin và ấn phẩm không có nghĩa là và không cấu thành, tài chính, đầu tư, kinh doanh, hoặc các loại lời khuyên hoặc khuyến nghị khác được cung cấp hoặc xác nhận bởi TradingView. Đọc thêm trong Điều khoản sử dụng.
The analyses provided are for informational purposes only and do not constitute financial advice or recommendations to buy or sell anything. The information presented is based on personal research and interpretation.
Bài đăng liên quan
Thông báo miễn trừ trách nhiệm
Thông tin và ấn phẩm không có nghĩa là và không cấu thành, tài chính, đầu tư, kinh doanh, hoặc các loại lời khuyên hoặc khuyến nghị khác được cung cấp hoặc xác nhận bởi TradingView. Đọc thêm trong Điều khoản sử dụng.