This chart forms part of a larger research note. None of the information posted here (TV) should be considered financial advice.
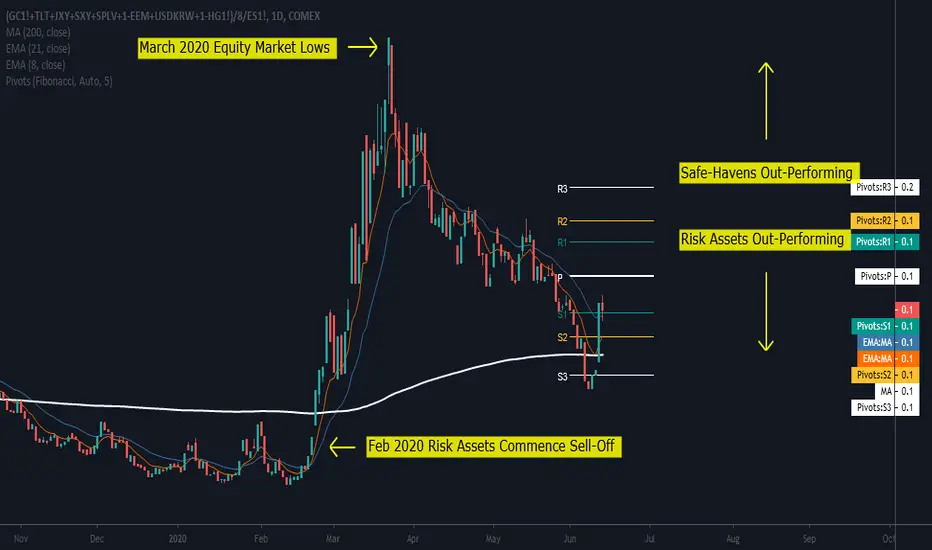
On a relative basis, safe-havens have out-performed risk assets for the past week. This is highlighted by the relative chart, using our custom Global Safe-Haven Index (SHIX) versus the S&P500 E-mini Futures (as a wide proxy for risk assets). Support was found on support level 3 (S3) as well as the flat 200-day simple moving average. The last close (Friday, 12 June) has seen the relative price closing above both the 8 and 21-day exponential moving average, both of which have started to lose downside momentum. Going forward (with a short to medium term view), I am expecting the Global Safe-Haven Index to challenge risk assets.
On a relative basis, safe-havens have out-performed risk assets for the past week. This is highlighted by the relative chart, using our custom Global Safe-Haven Index (SHIX) versus the S&P500 E-mini Futures (as a wide proxy for risk assets). Support was found on support level 3 (S3) as well as the flat 200-day simple moving average. The last close (Friday, 12 June) has seen the relative price closing above both the 8 and 21-day exponential moving average, both of which have started to lose downside momentum. Going forward (with a short to medium term view), I am expecting the Global Safe-Haven Index to challenge risk assets.
Thông báo miễn trừ trách nhiệm
Thông tin và các ấn phẩm này không nhằm mục đích, và không cấu thành, lời khuyên hoặc khuyến nghị về tài chính, đầu tư, giao dịch hay các loại khác do TradingView cung cấp hoặc xác nhận. Đọc thêm tại Điều khoản Sử dụng.
Thông báo miễn trừ trách nhiệm
Thông tin và các ấn phẩm này không nhằm mục đích, và không cấu thành, lời khuyên hoặc khuyến nghị về tài chính, đầu tư, giao dịch hay các loại khác do TradingView cung cấp hoặc xác nhận. Đọc thêm tại Điều khoản Sử dụng.