Gold analysis next target :
Chart Details
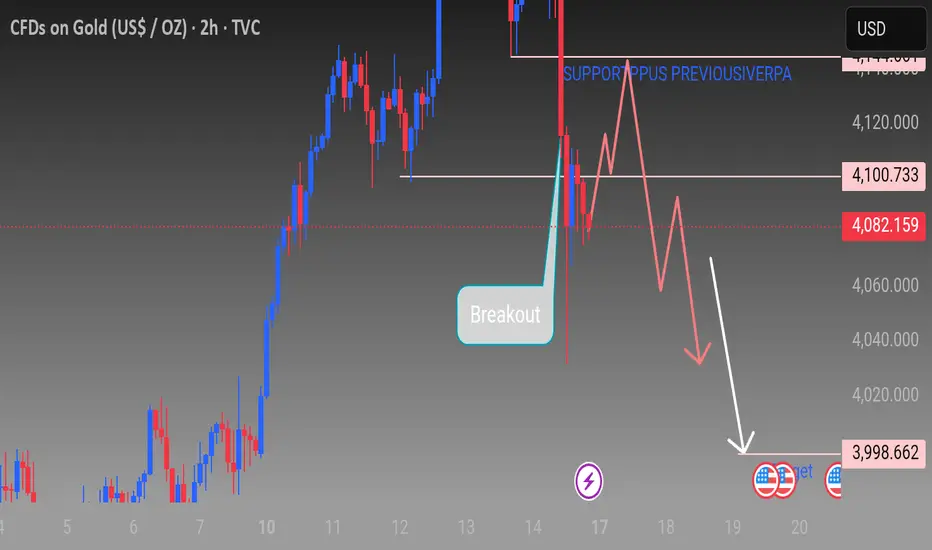
- *Instrument*: CFDs on Gold (US$/OZ)
- *Timeframe*: 2 hours
- *Platform*: TradingView (TVC)
- *Current Price*: $4,082.159 (down -88.991 or -2.13%)
- *Sell/Buy Prices*:
- Sell: $4,082.159 with 1,922
- Buy: $4,084.081
Chart Analysis
- *Trend Indication*: A downward trend is shown with an arrow pointing towards $3,998.662.
- *Breakout*: A breakout is marked on the chart.
- *Support/Resistance*:
- Support plus previous resistance area is marked around $4,100.733.
- Current price ($4,082.159) is below this level.
Other Chart Elements
- *Price Levels*: Prices ranging from $3,998.662 to $4,125.000 are shown on the right side of the chart.
- *Candlestick Chart*: The chart displays red and blue candlesticks indicating price movements.
Please drop your comments below if you found it helpful thanks
Chart Details
- *Instrument*: CFDs on Gold (US$/OZ)
- *Timeframe*: 2 hours
- *Platform*: TradingView (TVC)
- *Current Price*: $4,082.159 (down -88.991 or -2.13%)
- *Sell/Buy Prices*:
- Sell: $4,082.159 with 1,922
- Buy: $4,084.081
Chart Analysis
- *Trend Indication*: A downward trend is shown with an arrow pointing towards $3,998.662.
- *Breakout*: A breakout is marked on the chart.
- *Support/Resistance*:
- Support plus previous resistance area is marked around $4,100.733.
- Current price ($4,082.159) is below this level.
Other Chart Elements
- *Price Levels*: Prices ranging from $3,998.662 to $4,125.000 are shown on the right side of the chart.
- *Candlestick Chart*: The chart displays red and blue candlesticks indicating price movements.
Please drop your comments below if you found it helpful thanks
Free Forex signals & Daily updates 💹
t.me/+D1falYavqJAxMzE0
For any assistance contact us 🤓
t.me/Travis_816
Join Us Today On Telegram 👆👆
t.me/+D1falYavqJAxMzE0
For any assistance contact us 🤓
t.me/Travis_816
Join Us Today On Telegram 👆👆
Thông báo miễn trừ trách nhiệm
Thông tin và các ấn phẩm này không nhằm mục đích, và không cấu thành, lời khuyên hoặc khuyến nghị về tài chính, đầu tư, giao dịch hay các loại khác do TradingView cung cấp hoặc xác nhận. Đọc thêm tại Điều khoản Sử dụng.