Gold Finds Strong Support: Golden Cross Signals Uptrend Ahead
Gold prices have recently shown signs of renewed strength,
finding solid support as a
powerful technical pattern — the Golden Cross — has formed on
the charts. This bullish signal is often viewed as the beginning of a potential long-term uptrend, attracting both institutional and retail traders seeking confirmation that momentum is shifting upward.
Understanding the Golden Cross
A Golden Cross occurs when the 50-day moving
average crosses above the 200-day moving average. This technical event indicates that
short-term momentum is overtaking long-term trends — a classic sign that buyers are regaining control after a period of consolidation or decline.
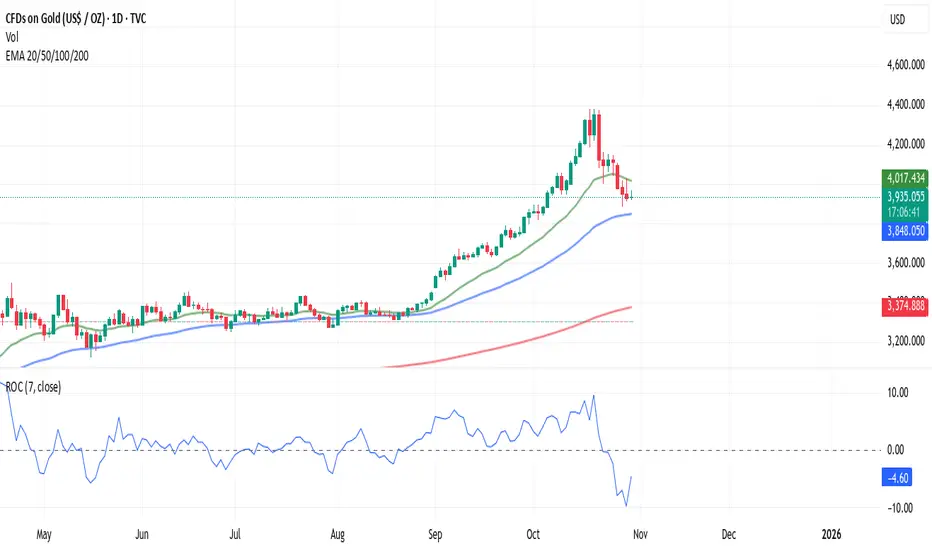
In the case of gold (XAU/USD), this crossover reflects growing optimism amid global economic uncertainty, weakening currencies,
and steady demand from central banks for bullion. The 50-day moving average has now pushed above the 200-day line, confirming bullish sentiment and technical support.
Support Levels Holding Firm
Gold recently tested and bounced from a critical
support zone near $3,930 per ounce, showing
that buyers are stepping in aggressively at lower levels.
The price has since built a series of higher lows,
reinforcing the structure of an emerging uptrend.
Moreover, volume has been increasing during rallies —
a healthy sign that institutional traders are participating
in the move. Momentum indicators such as the MACD
have also turned positive, aligning with the bullish crossover
and strengthening the case for continued gains.
Why This Matters for Traders and Investors
The Golden Cross is not just a chart pattern — it reflects
a psychological shift. When it appears, traders often
interpret it as confirmation that a previous downtrend
has reversed. Historically, gold has tended to rally
strongly in the months following a confirmed Golden Cross.
Beyond the technical picture, fundamental tailwinds support the move:
Geopolitical uncertainty continues to drive safe-haven demand.
Central bank purchases remain strong,
particularly from emerging economies
diversifying away from the U.S. dollar.
Inflation concerns and lower real yields
make non-yielding assets like gold more attractive.
Outlook
With gold prices holding above the key $3,930 support
zone and the Golden Cross now confirmed,
the technical outlook points toward
further upside potential. A sustained move above
$4,000 could open the door to retesting all-time
highs and possibly breaking into a new bullish phase.
As long as the moving averages remain aligned
in bullish formation, pullbacks may be viewed
as buying opportunities rather than signs of weakness.
In summary:
Gold has found strong support at $3,930 and
is now guided higher by the momentum of a Golden
Cross — a signal that both technical traders
and long-term investors are watching closely.
The precious metal’s trend is turning golden once again.
Rocket boost this content to learn more
Disclaimer: Trading is risky
Please use a simulation trading account before
you trade with real money.
Gold prices have recently shown signs of renewed strength,
finding solid support as a
powerful technical pattern — the Golden Cross — has formed on
the charts. This bullish signal is often viewed as the beginning of a potential long-term uptrend, attracting both institutional and retail traders seeking confirmation that momentum is shifting upward.
Understanding the Golden Cross
A Golden Cross occurs when the 50-day moving
average crosses above the 200-day moving average. This technical event indicates that
short-term momentum is overtaking long-term trends — a classic sign that buyers are regaining control after a period of consolidation or decline.
In the case of gold (XAU/USD), this crossover reflects growing optimism amid global economic uncertainty, weakening currencies,
and steady demand from central banks for bullion. The 50-day moving average has now pushed above the 200-day line, confirming bullish sentiment and technical support.
Support Levels Holding Firm
Gold recently tested and bounced from a critical
support zone near $3,930 per ounce, showing
that buyers are stepping in aggressively at lower levels.
The price has since built a series of higher lows,
reinforcing the structure of an emerging uptrend.
Moreover, volume has been increasing during rallies —
a healthy sign that institutional traders are participating
in the move. Momentum indicators such as the MACD
have also turned positive, aligning with the bullish crossover
and strengthening the case for continued gains.
Why This Matters for Traders and Investors
The Golden Cross is not just a chart pattern — it reflects
a psychological shift. When it appears, traders often
interpret it as confirmation that a previous downtrend
has reversed. Historically, gold has tended to rally
strongly in the months following a confirmed Golden Cross.
Beyond the technical picture, fundamental tailwinds support the move:
Geopolitical uncertainty continues to drive safe-haven demand.
Central bank purchases remain strong,
particularly from emerging economies
diversifying away from the U.S. dollar.
Inflation concerns and lower real yields
make non-yielding assets like gold more attractive.
Outlook
With gold prices holding above the key $3,930 support
zone and the Golden Cross now confirmed,
the technical outlook points toward
further upside potential. A sustained move above
$4,000 could open the door to retesting all-time
highs and possibly breaking into a new bullish phase.
As long as the moving averages remain aligned
in bullish formation, pullbacks may be viewed
as buying opportunities rather than signs of weakness.
In summary:
Gold has found strong support at $3,930 and
is now guided higher by the momentum of a Golden
Cross — a signal that both technical traders
and long-term investors are watching closely.
The precious metal’s trend is turning golden once again.
Rocket boost this content to learn more
Disclaimer: Trading is risky
Please use a simulation trading account before
you trade with real money.
Bài đăng liên quan
Thông báo miễn trừ trách nhiệm
Thông tin và ấn phẩm không có nghĩa là và không cấu thành, tài chính, đầu tư, kinh doanh, hoặc các loại lời khuyên hoặc khuyến nghị khác được cung cấp hoặc xác nhận bởi TradingView. Đọc thêm trong Điều khoản sử dụng.
Bài đăng liên quan
Thông báo miễn trừ trách nhiệm
Thông tin và ấn phẩm không có nghĩa là và không cấu thành, tài chính, đầu tư, kinh doanh, hoặc các loại lời khuyên hoặc khuyến nghị khác được cung cấp hoặc xác nhận bởi TradingView. Đọc thêm trong Điều khoản sử dụng.