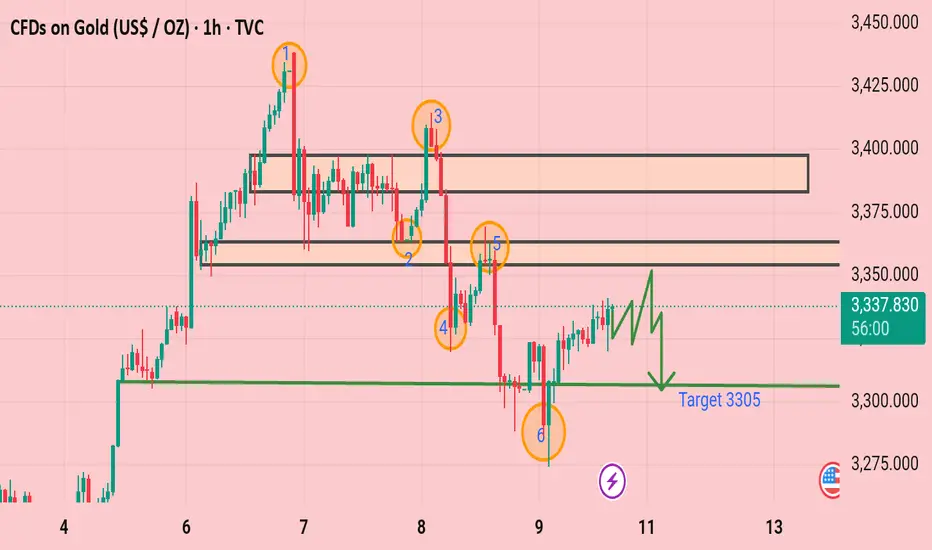
The chart you uploaded shows the price movement of Gold (XAU/USD) on a 1-hour timeframe from TradingView. Here are some key observations:
1. Resistance and Support Zones:
The chart highlights two major resistance zones around 3,400 and 3,360, shown as shaded rectangles.
A support zone is marked near the 3,305 level.
2. Labeled Points (1 to 6):
These numbered points indicate significant price action events or turning points.
Point 1: A peak after an upward trend, indicating resistance.
Point 2: A pullback, showing resistance holding.
Point 3: Another attempt to break resistance, followed by a sharp drop.
Point 4 and 5: Lower highs, confirming a downtrend.
Point 6: A strong support test near 3,305, with a rebound.
3. Price Movement and Trend:
The chart suggests a downtrend after failing to sustain above the resistance zone.
The drawn arrow points downward toward the 3,305 level, indicating a possible bearish target.
Current price: 3,337.33, with a recent bounce from support.
4. Projected Target:
The chart indicates a target of around 3,305, suggesting a bearish bias.
Would you like a more detailed technical analysis or insight into trading strategies based on this chart?
Đóng lệnh: đạt mục tiêu
Gold Target Successfully Archived.t.me/TheMoneyPrinter_Mentorship
XAUUSD GOLD + BTCUSD Daily 5-6 Free Signals📊🚀
✅GOLD
✅BTC
✅EURUSD
✅USDJPY
TELEGRAM CHANNEL 👇🏻👇🏻👇🏻👇🏻👇🏻👇🏻
t.me/TheMoneyPrinter_Mentorship
XAUUSD GOLD + BTCUSD Daily 5-6 Free Signals📊🚀
✅GOLD
✅BTC
✅EURUSD
✅USDJPY
TELEGRAM CHANNEL 👇🏻👇🏻👇🏻👇🏻👇🏻👇🏻
t.me/TheMoneyPrinter_Mentorship
Thông báo miễn trừ trách nhiệm
Thông tin và ấn phẩm không có nghĩa là và không cấu thành, tài chính, đầu tư, kinh doanh, hoặc các loại lời khuyên hoặc khuyến nghị khác được cung cấp hoặc xác nhận bởi TradingView. Đọc thêm trong Điều khoản sử dụng.
t.me/TheMoneyPrinter_Mentorship
XAUUSD GOLD + BTCUSD Daily 5-6 Free Signals📊🚀
✅GOLD
✅BTC
✅EURUSD
✅USDJPY
TELEGRAM CHANNEL 👇🏻👇🏻👇🏻👇🏻👇🏻👇🏻
t.me/TheMoneyPrinter_Mentorship
XAUUSD GOLD + BTCUSD Daily 5-6 Free Signals📊🚀
✅GOLD
✅BTC
✅EURUSD
✅USDJPY
TELEGRAM CHANNEL 👇🏻👇🏻👇🏻👇🏻👇🏻👇🏻
t.me/TheMoneyPrinter_Mentorship
Thông báo miễn trừ trách nhiệm
Thông tin và ấn phẩm không có nghĩa là và không cấu thành, tài chính, đầu tư, kinh doanh, hoặc các loại lời khuyên hoặc khuyến nghị khác được cung cấp hoặc xác nhận bởi TradingView. Đọc thêm trong Điều khoản sử dụng.