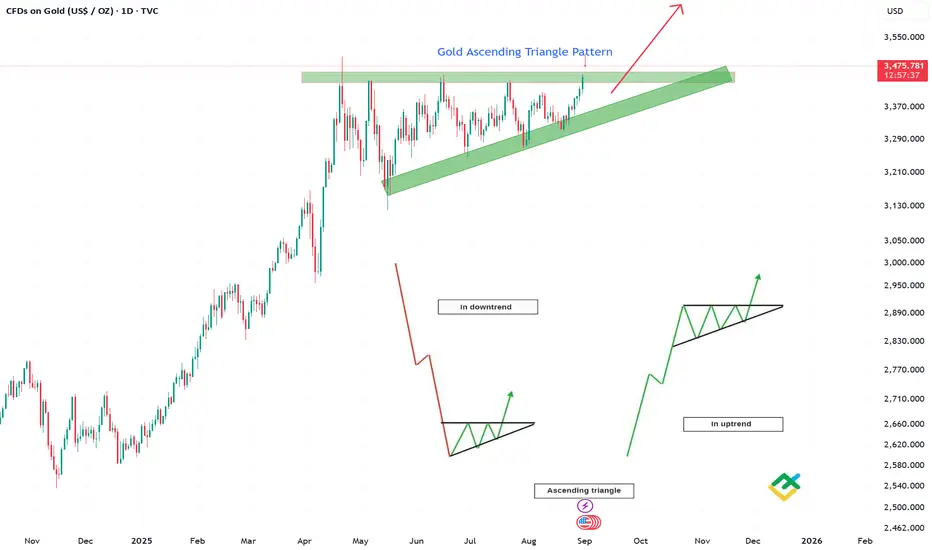
Gold is painting a compelling technical picture on the daily chart, consolidating within a clear Ascending Triangle pattern—a classic continuation signal that often breaks to the upside.
Pattern Structure:
Support: A rising trendline connecting higher lows, indicating consistent buying pressure at increasingly elevated levels.
Resistance: A horizontal barrier near the $3,477 - $3,550 zone, which has been tested multiple times, confirming its significance.
Key Levels:
Breakout Target: A successful breakout above $3,550 could trigger a measured move projection targeting $3,800+, based on the pattern's height.
Support to Hold: The pattern remains valid as long as price holds above the ascending support. A break below could invalidate the setup and signal a deeper pullback.
Volume & Momentum:
The formation of higher lows suggests accumulation and weakening selling pressure at key resistance.
A breakout accompanied by rising volume would strongly confirm bullish momentum.
Macro Context:
This pattern forms within a larger uptrend, reinforcing its reliability. Gold's role as a safe-haven asset amid global economic uncertainty continues to underpin demand.
Trading Outlook:
Bulls should await a decisive close above $3,550 to enter, targeting new all-time highs.
Bears need a break below the ascending trendline to regain control.
Giao dịch được đóng thủ công
Thông báo miễn trừ trách nhiệm
Thông tin và các ấn phẩm này không nhằm mục đích, và không cấu thành, lời khuyên hoặc khuyến nghị về tài chính, đầu tư, giao dịch hay các loại khác do TradingView cung cấp hoặc xác nhận. Đọc thêm tại Điều khoản Sử dụng.
Thông báo miễn trừ trách nhiệm
Thông tin và các ấn phẩm này không nhằm mục đích, và không cấu thành, lời khuyên hoặc khuyến nghị về tài chính, đầu tư, giao dịch hay các loại khác do TradingView cung cấp hoặc xác nhận. Đọc thêm tại Điều khoản Sử dụng.