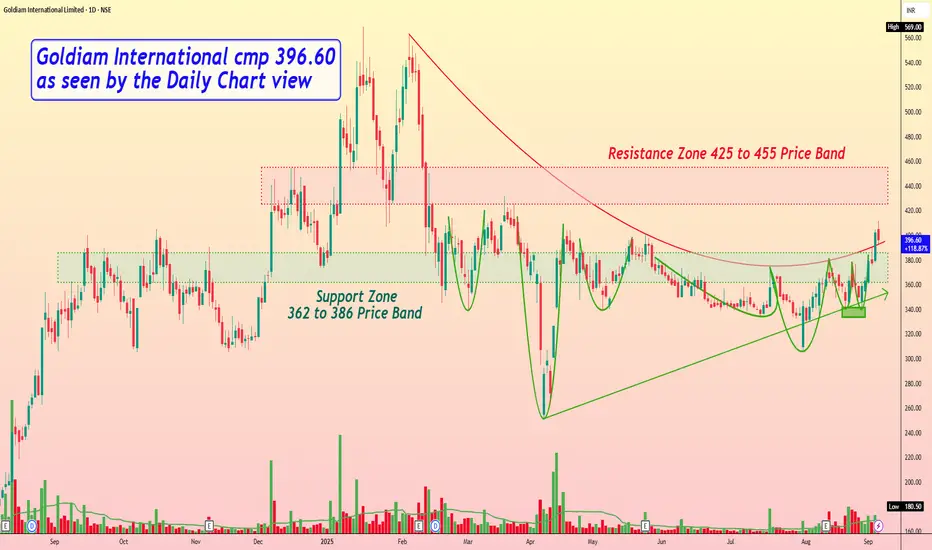
Goldiam International cmp 396.60 as seen by the Daily Chart view
- Support Zone 362 to 386 Price Band
- Resistance Zone 425 to 455 Price Band
- Bullish "W" with Double Bottom formed at 340 price level
- Breakout attempted from Curved Falling Resistance Trendline
- Price momentum has well respected the Rising Support Trendline
- Volumes spiking above avg traded quantity over the past few weeks
- Multiple Bullish Rounding Bottoms formed around Support Zone neckline
- Majority of common Technical Indicator BB, EMA, MACD, RSI trending positively
Thông báo miễn trừ trách nhiệm
Thông tin và các ấn phẩm này không nhằm mục đích, và không cấu thành, lời khuyên hoặc khuyến nghị về tài chính, đầu tư, giao dịch hay các loại khác do TradingView cung cấp hoặc xác nhận. Đọc thêm tại Điều khoản Sử dụng.
Thông báo miễn trừ trách nhiệm
Thông tin và các ấn phẩm này không nhằm mục đích, và không cấu thành, lời khuyên hoặc khuyến nghị về tài chính, đầu tư, giao dịch hay các loại khác do TradingView cung cấp hoặc xác nhận. Đọc thêm tại Điều khoản Sử dụng.