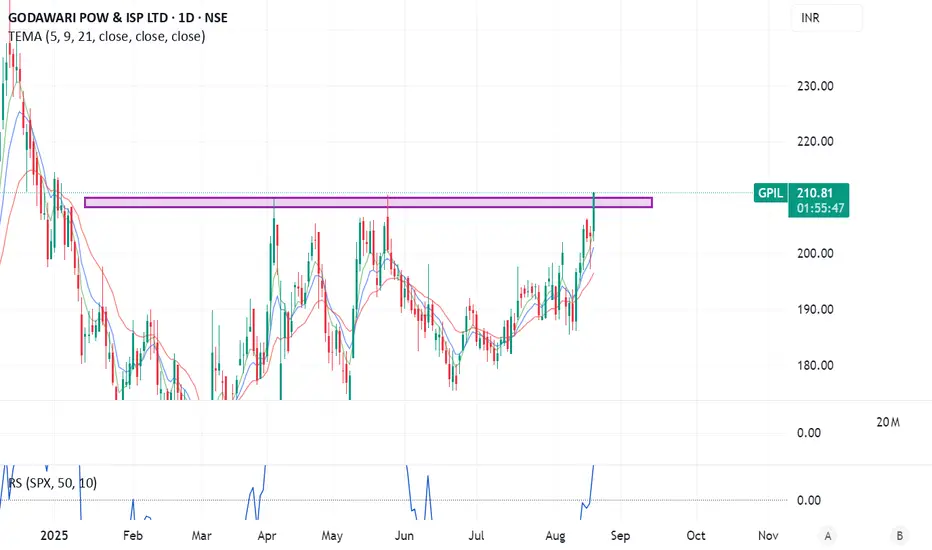
Technical Analysis (Daily Chart)
Indicator Setup: The price is trading above the 5, 9 & 13 EMAs—all aligned bullishly—indicating a positive trend.
Key Levels:
Resistance Turned Support: Around ₹203–205
Next Resistance / Target Zone: Near ₹217–220 (recent swing high)
Momentum: The breakout above the consolidation zone is showing strength.
Trade Plan:
Entry: On close above ₹206 (valid breakout confirmation)
Stop-Loss: ₹198–200 (below EMA cluster/support)
Targets:
Target 1: ₹217–220
Target 2: ₹235+ (stretch)
Fundamental Highlights
Key data from consolidated financials:
Market Cap: ~₹13,900 Cr
Valuation:
P/E approximately 18.6× — attractive vs sector peers (~30×)
P/B around 2.9–3.1×
Profitability:
ROCE: ~23.3%
ROE: ~17.3%
Profitability Trends:
FY24 consolidated profit: ~₹917 Cr; FY25: ~₹770 Cr (YoY decline ~16%)
Growth Metrics:
5-year sales growth: ~10% (modest)
Q1 FY26 net margin: ~17.7%
Strengths:
Virtually debt-free—robust balance sheet
Healthy returns and steady margin profile
Weaknesses:
Sluggish top-line growth
Moderate payout/investment intensity
Thông báo miễn trừ trách nhiệm
Thông tin và các ấn phẩm này không nhằm mục đích, và không cấu thành, lời khuyên hoặc khuyến nghị về tài chính, đầu tư, giao dịch hay các loại khác do TradingView cung cấp hoặc xác nhận. Đọc thêm tại Điều khoản Sử dụng.
Thông báo miễn trừ trách nhiệm
Thông tin và các ấn phẩm này không nhằm mục đích, và không cấu thành, lời khuyên hoặc khuyến nghị về tài chính, đầu tư, giao dịch hay các loại khác do TradingView cung cấp hoặc xác nhận. Đọc thêm tại Điều khoản Sử dụng.