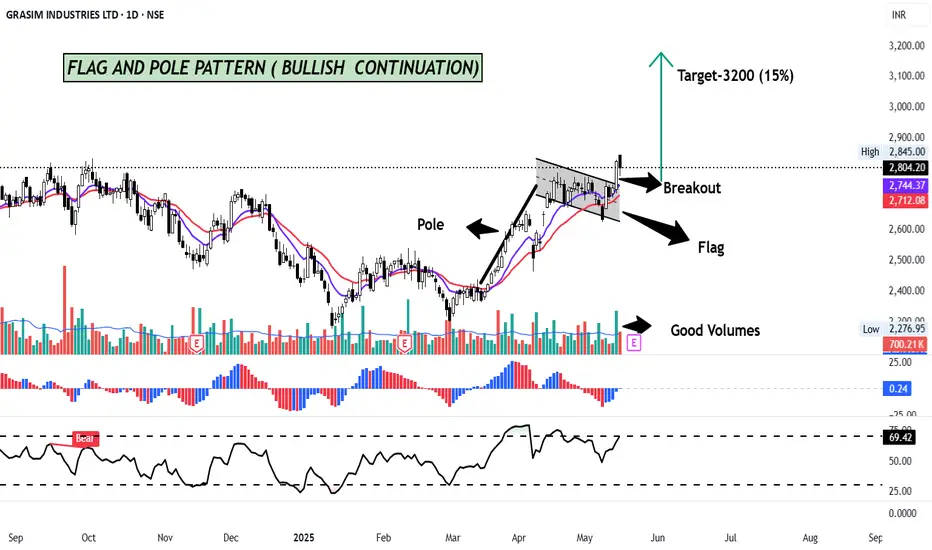
GRASIM has formed a FLAG AND POLE pattern on the Daily charts and has given a breakout with good volume.
The "flag and pole pattern" in technical analysis is a chart pattern that signals a potential continuation of an existing trend. It's characterized by a sharp, initial price movement (the "pole") followed by a period of consolidation (the "flag") within a defined range. A breakout from this range, in the same direction as the initial pole, suggests a likely continuation of the original trend
The target of this pattern signals an upside potential of 15% from the current price level in medium term.
Stock is trading above its 11 & 22 day EMA. RSI is at 69, signalling positive momentum.
CMP- Rs. 2804
Target Price- Rs 3200 ( 15% upside)
SL - 2704
Disclaimer: This is not a buy/sell recommendation. For educational purpose only. Kindly consult your financial advisor before entering a trade.
Thông báo miễn trừ trách nhiệm
Thông tin và các ấn phẩm này không nhằm mục đích, và không cấu thành, lời khuyên hoặc khuyến nghị về tài chính, đầu tư, giao dịch hay các loại khác do TradingView cung cấp hoặc xác nhận. Đọc thêm tại Điều khoản Sử dụng.
Thông báo miễn trừ trách nhiệm
Thông tin và các ấn phẩm này không nhằm mục đích, và không cấu thành, lời khuyên hoặc khuyến nghị về tài chính, đầu tư, giao dịch hay các loại khác do TradingView cung cấp hoặc xác nhận. Đọc thêm tại Điều khoản Sử dụng.