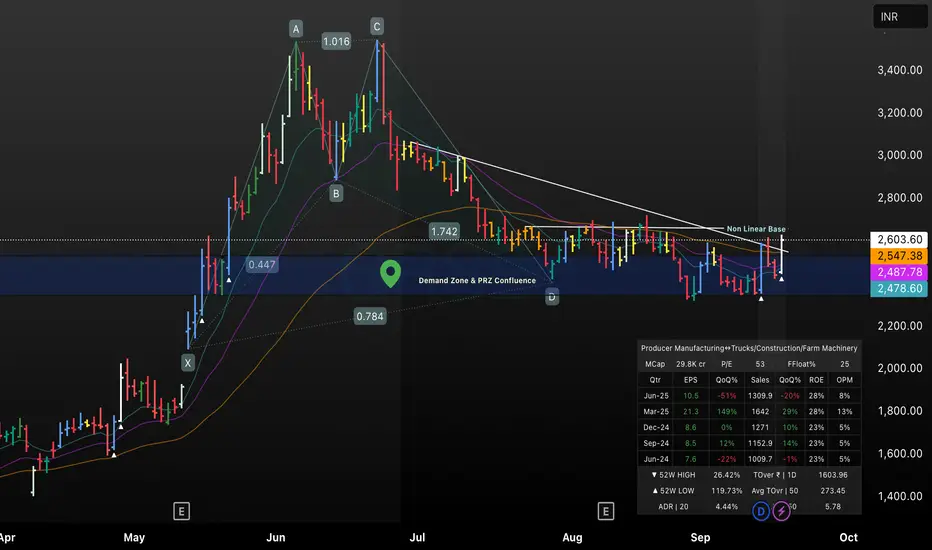
This TradingView chart presents the price action of GRSE, highlighting a demand zone and PRZ confluence area where the price reacted strongly before advancing to a Nonlinear Base resistance. The chart features a bullish breakout above key moving averages and trendlines, supported by volume and EPS growth data. Technical overlays include harmonic pattern completion, multi-timeframe support, and a clear visual of recent momentum shift, making this setup ideal for swing traders seeking confirmation in price-volume synergy and fundamental strength.
Thông báo miễn trừ trách nhiệm
Thông tin và ấn phẩm không có nghĩa là và không cấu thành, tài chính, đầu tư, kinh doanh, hoặc các loại lời khuyên hoặc khuyến nghị khác được cung cấp hoặc xác nhận bởi TradingView. Đọc thêm trong Điều khoản sử dụng.
Thông báo miễn trừ trách nhiệm
Thông tin và ấn phẩm không có nghĩa là và không cấu thành, tài chính, đầu tư, kinh doanh, hoặc các loại lời khuyên hoặc khuyến nghị khác được cung cấp hoặc xác nhận bởi TradingView. Đọc thêm trong Điều khoản sử dụng.