GAP resistance again
Blue line from the highest high and down trending
[the recent high breaking this trend all QE ? ]
channels are resistance zones from gaps and hi/low peaks [ R&S}
[ hate i can not see chart while making comments ! ]
seeing if secondary resistance lines are S&R - noticing gaps in these channels occasionally
Ghi chú
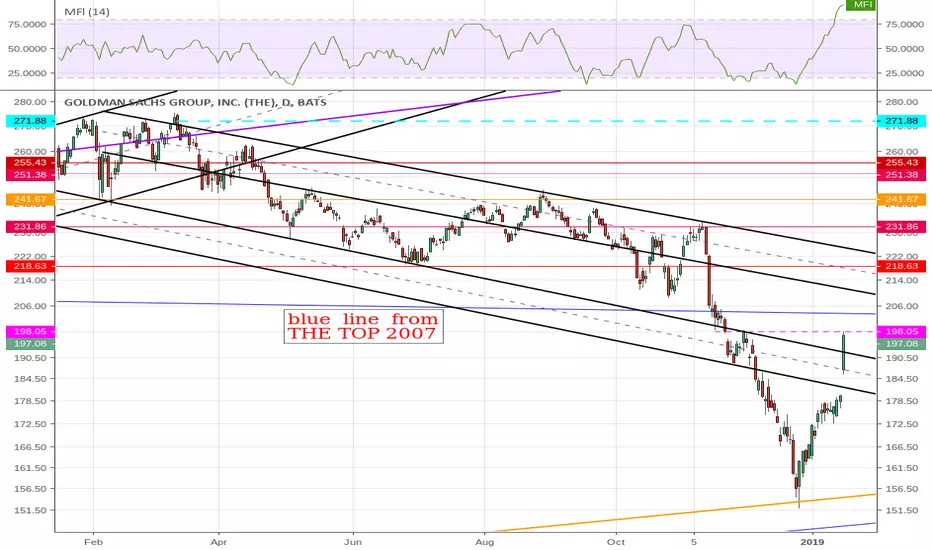
the blue line which is the top from 10/15/2007 and
down-trending from 6/1/2015
below 5/2017 bottom
seems to be a resistance here
waiting to see what happens when we get to down trend black channel
Thông báo miễn trừ trách nhiệm
The information and publications are not meant to be, and do not constitute, financial, investment, trading, or other types of advice or recommendations supplied or endorsed by TradingView. Read more in the Terms of Use.
Thông báo miễn trừ trách nhiệm
The information and publications are not meant to be, and do not constitute, financial, investment, trading, or other types of advice or recommendations supplied or endorsed by TradingView. Read more in the Terms of Use.