🔎 Chart Structure
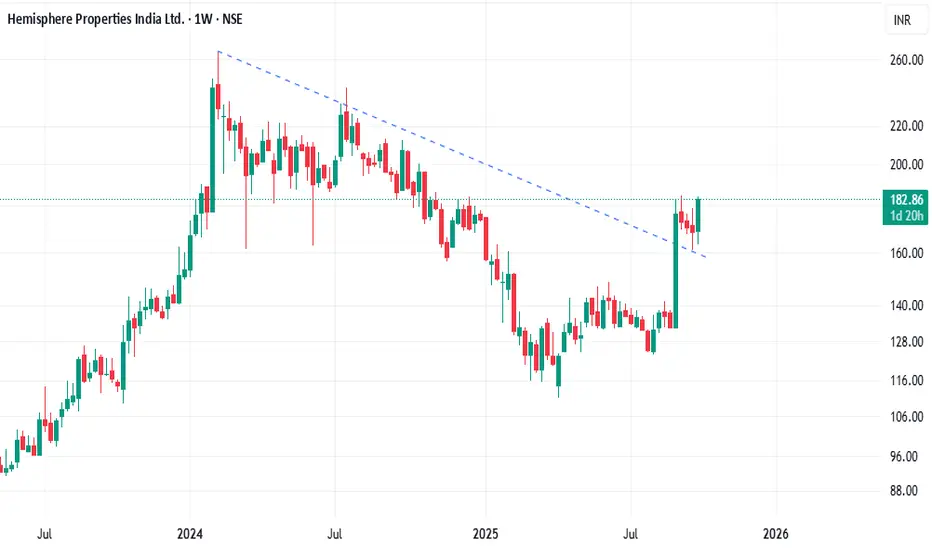
The stock was in a prolonged downtrend since early 2024, capped by a falling trendline.
Recently, it gave a trendline breakout above the ₹175–₹180 zone.
Importantly, the breakout has been retested successfully – price dipped towards the trendline support, held firmly, and bounced back.
This retest adds strength and reliability to the breakout, suggesting a shift in trend from bearish to bullish.
📈 Trend & Indicators
Sustaining above ₹180 confirms bullish control.
Next resistance levels: ₹200–₹205 zone (swing high) and ₹225 (medium-term).
Supports: Immediate at ₹165, stronger support near ₹145.
Weekly momentum is turning positive, confirming renewed buying interest.
⚠️ Risk Factors
If the stock falls back below ₹165, the breakout may fail, leading to consolidation.
Sectoral news and overall market conditions will heavily influence momentum.
🎯 View
Bias: Bullish (Post Breakout & Retest Confirmation)
Targets: ₹200 (short-term), ₹225 (medium-term).
Stop Loss (Positional): ₹160 (weekly closing).
📌 Disclaimer
This analysis is for educational and informational purposes only. It is based on technical observations and does not constitute investment advice. Investors should consult a SEBI-registered financial advisor before making investment decisions.
Thông báo miễn trừ trách nhiệm
Thông tin và các ấn phẩm này không nhằm mục đích, và không cấu thành, lời khuyên hoặc khuyến nghị về tài chính, đầu tư, giao dịch hay các loại khác do TradingView cung cấp hoặc xác nhận. Đọc thêm tại Điều khoản Sử dụng.
Thông báo miễn trừ trách nhiệm
Thông tin và các ấn phẩm này không nhằm mục đích, và không cấu thành, lời khuyên hoặc khuyến nghị về tài chính, đầu tư, giao dịch hay các loại khác do TradingView cung cấp hoặc xác nhận. Đọc thêm tại Điều khoản Sử dụng.