HERITGFOOD - Cup & Handle Breakout with RSI Confirmation | Daily
📊 HERITAGE FOODS LTD (HERITGFOOD) – Cup & Handle Breakout with RSI Confirmation | Daily Chart
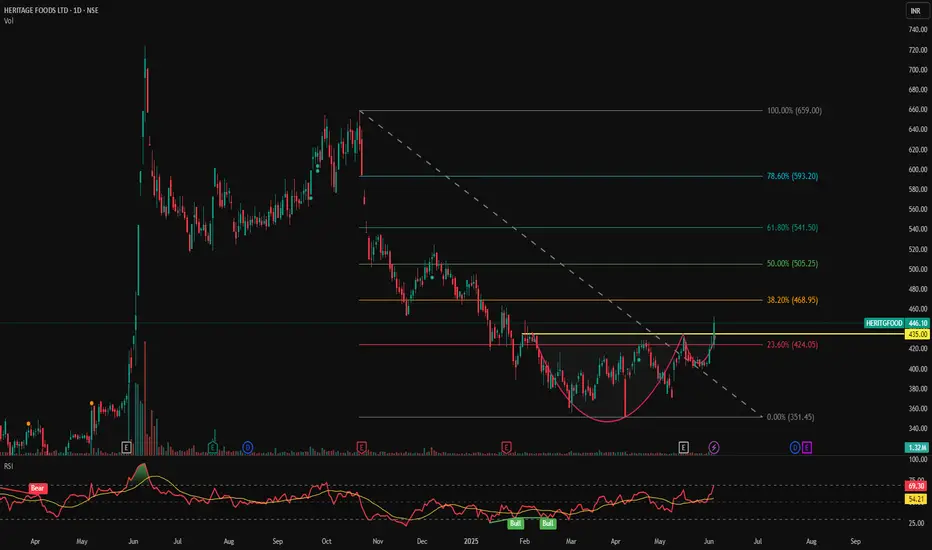
📅 Chart Date: June 5, 2025
📈 CMP: ₹446.10 (+5.94%)
📍 Ticker: NSE:HERITGFOOD
🔍 Technical Analysis Overview
☕ Cup & Handle Pattern Breakout
HERITGFOOD has successfully broken out of a Cup & Handle pattern, signaling the end of a long downtrend and a potential start of a new bullish wave. The breakout zone lies around ₹435–₹440.
💥 Breakout Volume: Supported by a strong surge in volume (~1.32M), adding conviction to the breakout.
📉 RSI Indicator:
RSI is at 69.30, just below overbought territory, indicating strong momentum.
RSI crossover above signal line confirms bullish strength.
📍 Key Price Levels
✅ Breakout Zone: ₹435–₹440
🚀 Upside Targets (based on pattern projection and past resistance):
₹470 – minor resistance
₹510 – medium-term swing target
₹550+ – extended target if momentum sustains
🛡️ Support Levels:
₹435 – breakout retest zone
₹415 – minor base
₹390 – handle bottom (critical invalidation)
🔻 Stop Loss Zone: Below ₹415–₹420 for risk-managed swing positions
🛠️ Trading Strategy
Entry: After confirmation candle above ₹440 or on pullback to retest breakout zone
Stop Loss: Below ₹415
Targets: ₹470 → ₹510 → ₹550+
Risk/Reward: Attractive R:R setup with confirmation indicators
⚠️ Disclaimer
This chart is for educational and analysis purposes only. Please consult a SEBI-registered financial advisor before taking any trading decision.
Đóng lệnh: đạt mục tiêu
The first resistance level has been touched. If the trend is to continue, it's important to follow a trailing stop-loss strategy and patiently wait for the price to approach the second resistance level.Thông báo miễn trừ trách nhiệm
Thông tin và các ấn phẩm này không nhằm mục đích, và không cấu thành, lời khuyên hoặc khuyến nghị về tài chính, đầu tư, giao dịch hay các loại khác do TradingView cung cấp hoặc xác nhận. Đọc thêm tại Điều khoản Sử dụng.
Thông báo miễn trừ trách nhiệm
Thông tin và các ấn phẩm này không nhằm mục đích, và không cấu thành, lời khuyên hoặc khuyến nghị về tài chính, đầu tư, giao dịch hay các loại khác do TradingView cung cấp hoặc xác nhận. Đọc thêm tại Điều khoản Sử dụng.