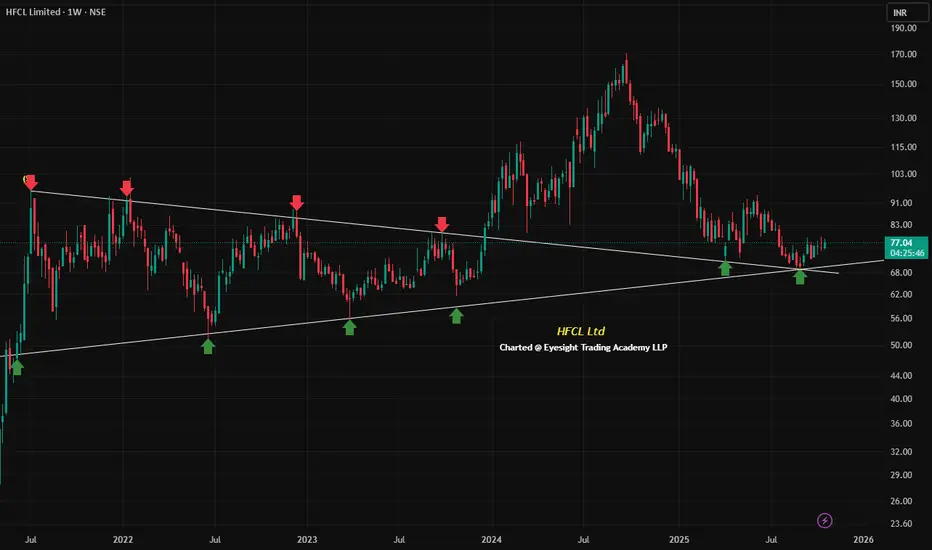
HFCL Ltd. is currently trading around ₹77.12 and presenting an interesting technical setup for chart watchers and swing traders. On the weekly timeframe, the stock is attempting to respect two key support zones simultaneously:
🟢 Weekly trendline support: This trendline has held firm across multiple swing lows, and HFCL is now testing it again, suggesting potential continuation if buyers step in.
🔄 Resistance turned support: A prior weekly resistance level has now flipped into support, reinforcing the zone around ₹76–₹77 as a critical area for price action.
This confluence of supports could act as a launchpad for bullish momentum, provided volume confirms the move and broader market sentiment remains favorable. Traders may watch for a strong close above ₹78–₹79 to validate a breakout attempt, while keeping an eye on downside protection below ₹68.
📌 Educational Insight: When a stock tests multiple support levels—especially on higher timeframes like weekly charts—it often signals a high-probability zone for reversal or continuation. However, confirmation through price action and volume is essential before taking positions.
💡 Always combine technical setups with risk management and broader market context. HFCL’s current structure is worth monitoring for potential breakout behavior.
For Educational Purpose only : Live chart Example
Thông báo miễn trừ trách nhiệm
Thông tin và ấn phẩm không có nghĩa là và không cấu thành, tài chính, đầu tư, kinh doanh, hoặc các loại lời khuyên hoặc khuyến nghị khác được cung cấp hoặc xác nhận bởi TradingView. Đọc thêm trong Điều khoản sử dụng.
Thông báo miễn trừ trách nhiệm
Thông tin và ấn phẩm không có nghĩa là và không cấu thành, tài chính, đầu tư, kinh doanh, hoặc các loại lời khuyên hoặc khuyến nghị khác được cung cấp hoặc xác nhận bởi TradingView. Đọc thêm trong Điều khoản sử dụng.