HGS - Rising Wedge Breakout on Volume Spike | Daily Chart
📊 HGS – Rising Wedge Breakout on Volume Spike | RSI Above 70 | Fresh Bullish Momentum
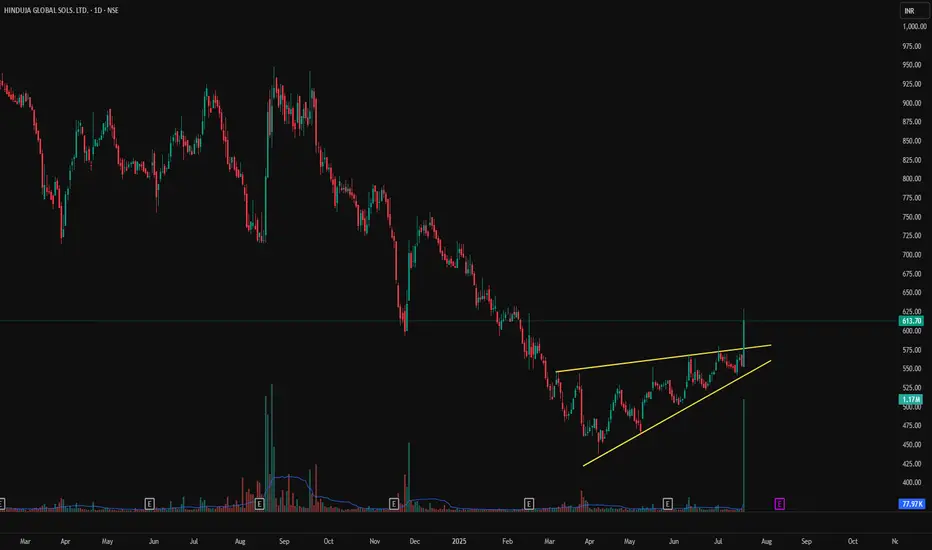
📅 Chart Date: July 17, 2025
📍 CMP: ₹613.70 (+10.72%)
📈 Symbol: NSE:HGS | 1D Timeframe
🔍 Technical Analysis Breakdown
🔺 Rising Wedge Breakout
Price broke above the upper resistance of a rising wedge pattern.
Strong confirmation with a wide bullish candle and volume spike.
📊 Volume Surge
Volume: 1.17M against average volume of ~78K
Sudden institutional interest or news-based momentum likely behind the move.
📉 RSI (14, close): 73.03
RSI crossed into overbought territory, showing strong bullish momentum but could warrant caution or consolidation soon.
📌 Support & Resistance Levels
Breakout Zone: ₹580–₹590
Next Resistance: ₹650+ (gap-fill zone from earlier breakdown)
Support: ₹560 (upper trendline of broken wedge)
📌 Key Observations
First strong breakout since months of sideways to bullish accumulation.
Sustained close above ₹590–₹600 will confirm continuation.
Caution if price retraces inside wedge again.
🏁 Trade Setup
Entry: On Retest of ₹590–₹600
Target: ₹650 / ₹675
Stoploss: Below ₹560
Risk Level: Moderate (due to overbought RSI)
⚠️ Disclaimer: This is an educational chart setup and not trading advice. Please conduct your own research and risk management.
📣 Follow @PriceAction_Pulse for more such clean breakouts and chart pattern analysis!
🔁 Drop a comment if HGS is on your radar for the next breakout rally 📈
Thông báo miễn trừ trách nhiệm
Thông tin và các ấn phẩm này không nhằm mục đích, và không cấu thành, lời khuyên hoặc khuyến nghị về tài chính, đầu tư, giao dịch hay các loại khác do TradingView cung cấp hoặc xác nhận. Đọc thêm tại Điều khoản Sử dụng.
Thông báo miễn trừ trách nhiệm
Thông tin và các ấn phẩm này không nhằm mục đích, và không cấu thành, lời khuyên hoặc khuyến nghị về tài chính, đầu tư, giao dịch hay các loại khác do TradingView cung cấp hoặc xác nhận. Đọc thêm tại Điều khoản Sử dụng.