Is a time for HIPPOUSDT? Potential 50% - 0.0028 USD CRYPTO
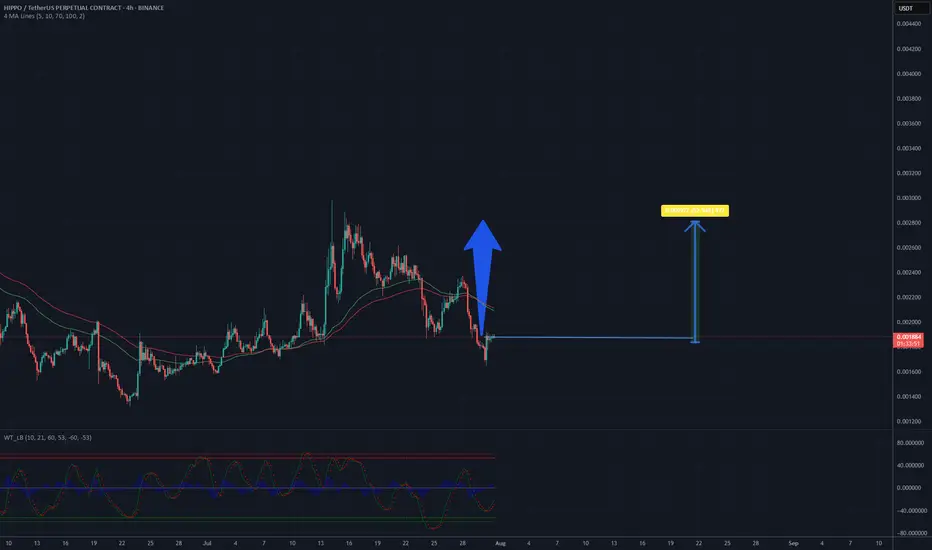
The chart displays a 4-hour candlestick pattern for the HIPPO/USDT perpetual contract on Binance, showing price movements from late June to mid-September 2025. The price has recently experienced a downward trend after reaching a peak, with a noticeable drop from around 0.0028 to the current level of approximately 0.00186. The moving averages (red and green lines) indicate a potential bearish crossover, suggesting continued downward pressure in the short term. However, the price is approaching a support level near 0.0017, where historical buying interest might emerge. The oscillator at the bottom shows mixed signals, with a slight uptick that could hint at a potential reversal if momentum builds. Based on this analysis, a price recovery to 0.0028 seems plausible if the support holds and buying volume increases in the coming sessions.
Potential TP: 0.0028 USD
Potential TP: 0.0028 USD
Thông báo miễn trừ trách nhiệm
Thông tin và các ấn phẩm này không nhằm mục đích, và không cấu thành, lời khuyên hoặc khuyến nghị về tài chính, đầu tư, giao dịch hay các loại khác do TradingView cung cấp hoặc xác nhận. Đọc thêm tại Điều khoản Sử dụng.
Thông báo miễn trừ trách nhiệm
Thông tin và các ấn phẩm này không nhằm mục đích, và không cấu thành, lời khuyên hoặc khuyến nghị về tài chính, đầu tư, giao dịch hay các loại khác do TradingView cung cấp hoặc xác nhận. Đọc thêm tại Điều khoản Sử dụng.