₹1,345.80 (NSE)
Day’s Range: ₹1,342.60 – ₹1,356.60
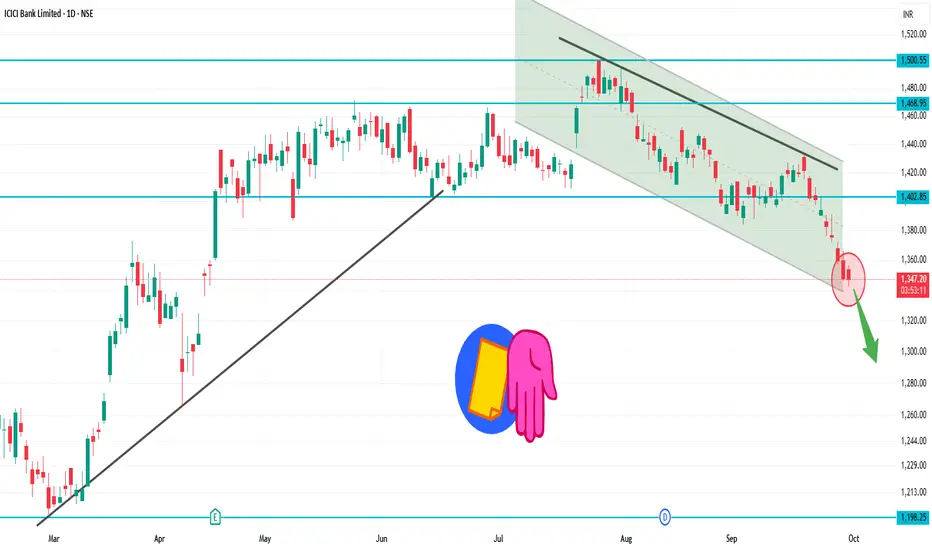
52-Week Range: ₹1,186.00 – ₹1,500.00
📉 Technical Overview
Trend: The stock is trading below its 200-day moving average, indicating a mildly bearish trend.
RSI: Currently at 26.6, suggesting the stock is in the oversold zone.
MACD: At -10.01, reinforcing the bearish momentum.
Moving Averages: A strong sell signal is indicated, with 0 buy signals and 12 sell signals across various timeframes.
🔼 Potential Upside (Rise)
Immediate Resistance: ₹1,355 – ₹1,365
Breakout Target: Above ₹1,365, the next resistance is around ₹1,380 – ₹1,390.
Bullish Confirmation: A close above ₹1,390 could signal a reversal or consolidation.
🔽 Potential Downside (Fall)
Immediate Support: ₹1,340 – ₹1,330
Breakdown Target: Below ₹1,330, the stock may test ₹1,310 – ₹1,300.
Bearish Confirmation: A close below ₹1,300 would strengthen the bearish outlook.
✅ Summary
Above ₹1,365: Potential rise toward ₹1,380 – ₹1,390.
Below ₹1,330: Potential fall toward ₹1,310 – ₹1,300.
Between ₹1,330 – ₹1,365: Likely range-bound movement.
Day’s Range: ₹1,342.60 – ₹1,356.60
52-Week Range: ₹1,186.00 – ₹1,500.00
📉 Technical Overview
Trend: The stock is trading below its 200-day moving average, indicating a mildly bearish trend.
RSI: Currently at 26.6, suggesting the stock is in the oversold zone.
MACD: At -10.01, reinforcing the bearish momentum.
Moving Averages: A strong sell signal is indicated, with 0 buy signals and 12 sell signals across various timeframes.
🔼 Potential Upside (Rise)
Immediate Resistance: ₹1,355 – ₹1,365
Breakout Target: Above ₹1,365, the next resistance is around ₹1,380 – ₹1,390.
Bullish Confirmation: A close above ₹1,390 could signal a reversal or consolidation.
🔽 Potential Downside (Fall)
Immediate Support: ₹1,340 – ₹1,330
Breakdown Target: Below ₹1,330, the stock may test ₹1,310 – ₹1,300.
Bearish Confirmation: A close below ₹1,300 would strengthen the bearish outlook.
✅ Summary
Above ₹1,365: Potential rise toward ₹1,380 – ₹1,390.
Below ₹1,330: Potential fall toward ₹1,310 – ₹1,300.
Between ₹1,330 – ₹1,365: Likely range-bound movement.
Bài đăng liên quan
Thông báo miễn trừ trách nhiệm
Thông tin và các ấn phẩm này không nhằm mục đích, và không cấu thành, lời khuyên hoặc khuyến nghị về tài chính, đầu tư, giao dịch hay các loại khác do TradingView cung cấp hoặc xác nhận. Đọc thêm tại Điều khoản Sử dụng.
Bài đăng liên quan
Thông báo miễn trừ trách nhiệm
Thông tin và các ấn phẩm này không nhằm mục đích, và không cấu thành, lời khuyên hoặc khuyến nghị về tài chính, đầu tư, giao dịch hay các loại khác do TradingView cung cấp hoặc xác nhận. Đọc thêm tại Điều khoản Sử dụng.