IDFC First Bank – Daily Chart Analysis
Timeframe: Daily chart observation.
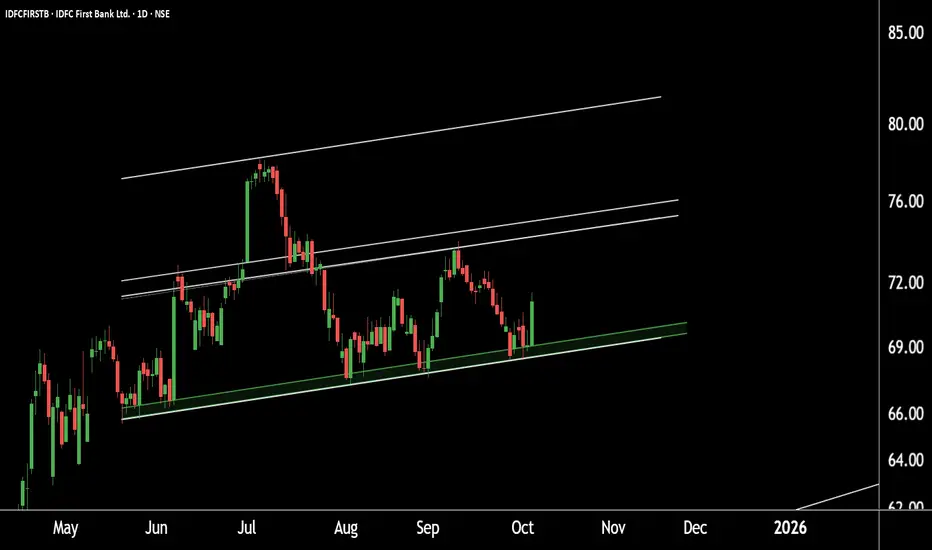
Price Structure: The stock is trading within a well-defined parallel channel.
Support Zone: Strong support identified near the ₹67–₹69 range.
Upside Target: If the support zone holds, the next potential upside target lies around ₹81–₹82.
Outlook: Sustaining above the support levels may lead to higher prices in the upcoming sessions.
Thank you.
Timeframe: Daily chart observation.
Price Structure: The stock is trading within a well-defined parallel channel.
Support Zone: Strong support identified near the ₹67–₹69 range.
Upside Target: If the support zone holds, the next potential upside target lies around ₹81–₹82.
Outlook: Sustaining above the support levels may lead to higher prices in the upcoming sessions.
Thank you.
@RahulSaraoge
Connect us at t.me/stridesadvisory
Connect us at t.me/stridesadvisory
Thông báo miễn trừ trách nhiệm
Thông tin và các ấn phẩm này không nhằm mục đích, và không cấu thành, lời khuyên hoặc khuyến nghị về tài chính, đầu tư, giao dịch hay các loại khác do TradingView cung cấp hoặc xác nhận. Đọc thêm tại Điều khoản Sử dụng.