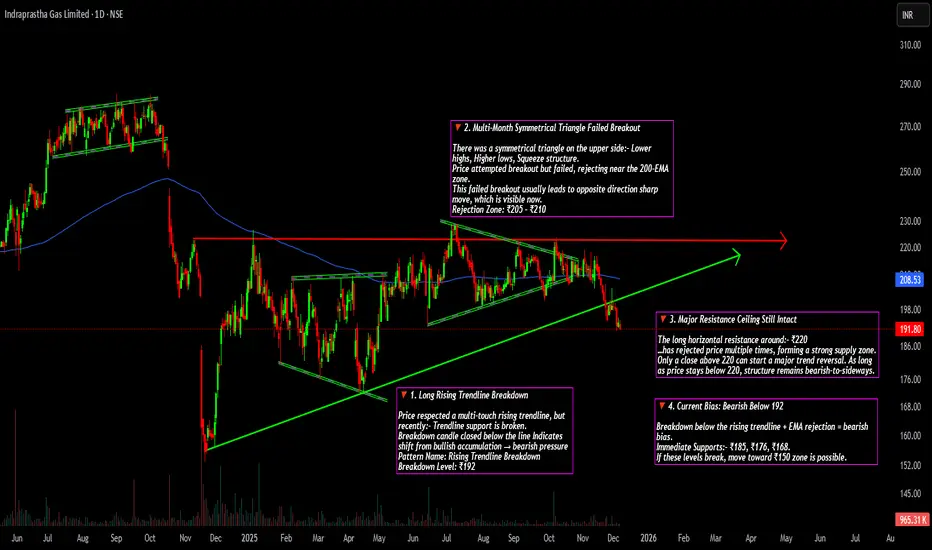
🔻 1. Long Rising Trendline Breakdown
Price respected a multi-touch rising trendline, but recently:- Trendline support is broken.
Breakdown candle closed below the line Indicates shift from bullish accumulation → bearish pressure
Pattern Name: Rising Trendline Breakdown
Breakdown Level: ₹192.
🔻 2. Multi-Month Symmetrical Triangle Failed Breakout
There was a symmetrical triangle on the upper side:- Lower highs, Higher lows, Squeeze structure.
Price attempted breakout but failed, rejecting near the 200-EMA zone.
This failed breakout usually leads to opposite direction sharp move, which is visible now.
Rejection Zone: ₹205 – ₹210.
🔻 3. Major Resistance Ceiling Still Intact
The long horizontal resistance around:- ₹220
…has rejected price multiple times, forming a strong supply zone. Only a close above 220 can start a major trend reversal. As long as price stays below 220, structure remains bearish-to-sideways.
🔻 4. Current Bias: Bearish Below 192
Breakdown below the rising trendline + EMA rejection = bearish bias.
Immediate Supports:- ₹185, ₹176, ₹168.
If these levels break, move toward ₹150 zone is possible.
Thông báo miễn trừ trách nhiệm
Thông tin và các ấn phẩm này không nhằm mục đích, và không cấu thành, lời khuyên hoặc khuyến nghị về tài chính, đầu tư, giao dịch hay các loại khác do TradingView cung cấp hoặc xác nhận. Đọc thêm tại Điều khoản Sử dụng.
Thông báo miễn trừ trách nhiệm
Thông tin và các ấn phẩm này không nhằm mục đích, và không cấu thành, lời khuyên hoặc khuyến nghị về tài chính, đầu tư, giao dịch hay các loại khác do TradingView cung cấp hoặc xác nhận. Đọc thêm tại Điều khoản Sử dụng.