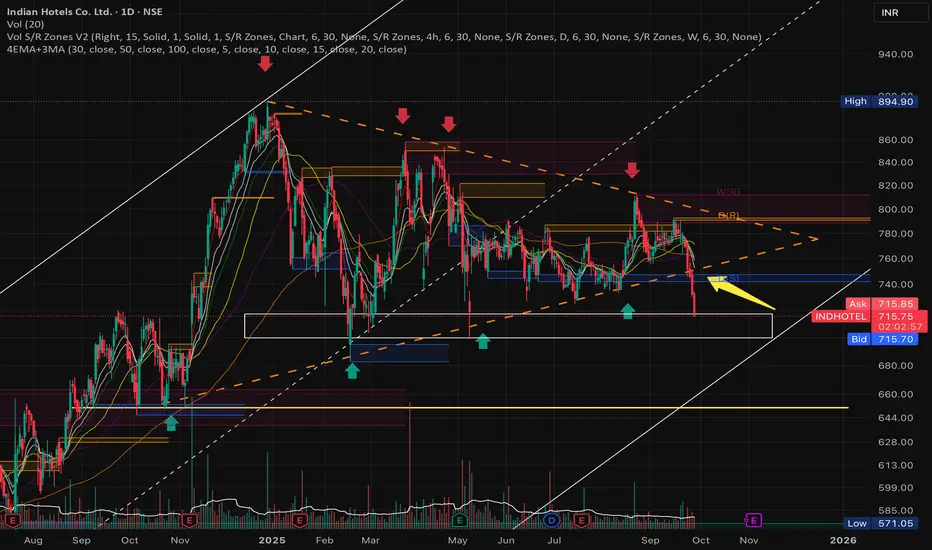
The chart has formed a symmetrical triangle pattern, which has taken shape over approximately 270 days. This pattern was recently broken, and a new support level has emerged around 713.
If the 713 support fails to hold, the next potential downside targets are 703, 695, and 685.
However, it's important to note that the stock remains in a broader upward trend, as illustrated by the ascending channel. As long as the price stays within this channel, any pullback toward the lower boundary could present a potential buying opportunity, suggesting a continuation of the uptrend.
Caution:
If the stock breaks below the channel, the current trend structure would be invalidated, and a fresh analysis would be required to reassess the setup.
Thông báo miễn trừ trách nhiệm
Thông tin và ấn phẩm không có nghĩa là và không cấu thành, tài chính, đầu tư, kinh doanh, hoặc các loại lời khuyên hoặc khuyến nghị khác được cung cấp hoặc xác nhận bởi TradingView. Đọc thêm trong Điều khoản sử dụng.
Thông báo miễn trừ trách nhiệm
Thông tin và ấn phẩm không có nghĩa là và không cấu thành, tài chính, đầu tư, kinh doanh, hoặc các loại lời khuyên hoặc khuyến nghị khác được cung cấp hoặc xác nhận bởi TradingView. Đọc thêm trong Điều khoản sử dụng.