Current Trend & Technical Overview
On daily analysis, the stock is in a Strong Buy zone, with all moving averages across 5-, 10-, 20-, 50-, 100-, and 200-day periods signaling buy, alongside predominantly bullish indicators such as RSI (~74.9), MACD, ADX, ROC, and more
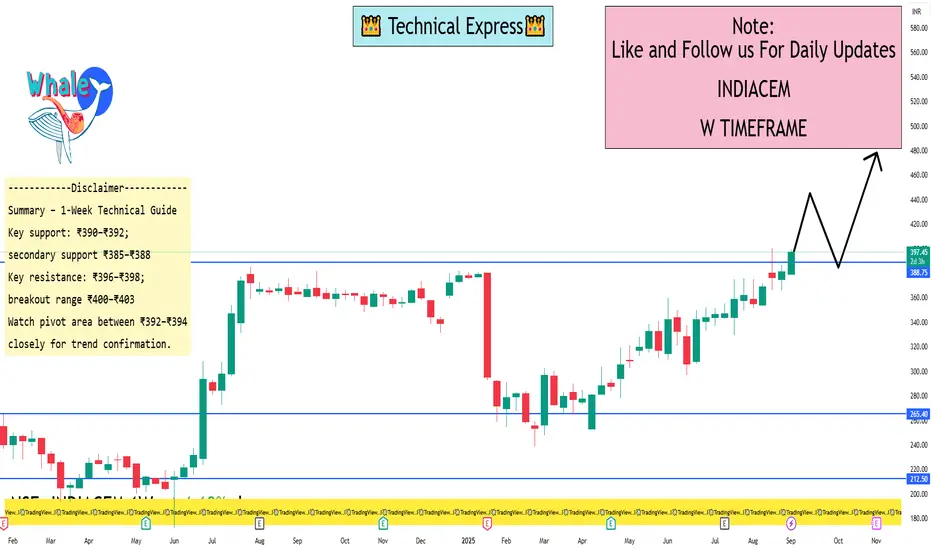
The stock is trading near its 52-week high (~₹400), with a current range of approximately ₹385–₹398
Analysts maintain a Strong Buy technical stance, though consensus price targets indicate potential downside (~₹282 avg target vs current ~₹397), suggesting valuation may be extended
1-Week Technical Levels
Pivot Points (from Investing.com data):
Classic Pivots (Daily):
S1: ₹390.16
Pivot: ₹392.48
R1: ₹396.61
R2: ₹398.93
R3: ₹403.06
Supports: down to ₹383.71
Fibonacci, Camarilla, and Woodie pivots are closely clustered—suggest key levels between ₹392–₹394 (pivot), with resistance around ₹396–₹398 and support near ₹386–₹390
TradingView Idea (dated August):
Bullish Entry: Daily close above ₹232/₹239, safe entry above ₹269.
Targets: ₹291–₹296 initially; further upside to ₹350–₹354 and ₹409–₹413.
Bearish Risk: Close below ₹223 may expose ₹203 and ₹173
(Note: Those levels are older and far below current prices; still helpful historically.)
On daily analysis, the stock is in a Strong Buy zone, with all moving averages across 5-, 10-, 20-, 50-, 100-, and 200-day periods signaling buy, alongside predominantly bullish indicators such as RSI (~74.9), MACD, ADX, ROC, and more
The stock is trading near its 52-week high (~₹400), with a current range of approximately ₹385–₹398
Analysts maintain a Strong Buy technical stance, though consensus price targets indicate potential downside (~₹282 avg target vs current ~₹397), suggesting valuation may be extended
1-Week Technical Levels
Pivot Points (from Investing.com data):
Classic Pivots (Daily):
S1: ₹390.16
Pivot: ₹392.48
R1: ₹396.61
R2: ₹398.93
R3: ₹403.06
Supports: down to ₹383.71
Fibonacci, Camarilla, and Woodie pivots are closely clustered—suggest key levels between ₹392–₹394 (pivot), with resistance around ₹396–₹398 and support near ₹386–₹390
TradingView Idea (dated August):
Bullish Entry: Daily close above ₹232/₹239, safe entry above ₹269.
Targets: ₹291–₹296 initially; further upside to ₹350–₹354 and ₹409–₹413.
Bearish Risk: Close below ₹223 may expose ₹203 and ₹173
(Note: Those levels are older and far below current prices; still helpful historically.)
I built a Buy & Sell Signal Indicator with 85% accuracy.
📈 Get access via DM or
WhatsApp: wa.link/d997q0
| Email: techncialexpress@gmail.com
| Script Coder | Trader | Investor | From India
📈 Get access via DM or
WhatsApp: wa.link/d997q0
| Email: techncialexpress@gmail.com
| Script Coder | Trader | Investor | From India
Bài đăng liên quan
Thông báo miễn trừ trách nhiệm
Thông tin và ấn phẩm không có nghĩa là và không cấu thành, tài chính, đầu tư, kinh doanh, hoặc các loại lời khuyên hoặc khuyến nghị khác được cung cấp hoặc xác nhận bởi TradingView. Đọc thêm trong Điều khoản sử dụng.