🟣  INDUSINDBK – Symmetrical Chart Pattern Break & Reclaim Setup
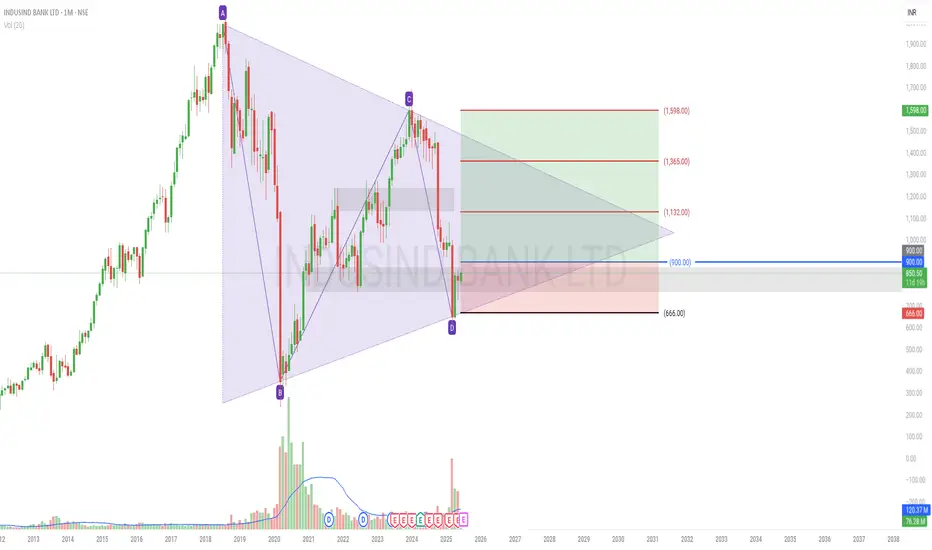
• Timeframe: Monthly
• Pattern: Symmetrical Triangle
• Outlook: Positional / 6–12 Months
• Plan of Action:
Entry: ₹900+ (on confirmation)
Stop-Loss: ₹666 (swing low / pattern invalidation)
Target 1: ₹1,132
Target 2: ₹1,365
Target 3: ₹1,598
• Why This Setup Stands Out:
Clean symmetrical triangle respected over time
Volume spike at key zone suggests potential smart money activity
₹900 is both technical resistance and a psychological level
Well-defined R:R with multi-target structure
Note: This is a positional idea — enter only on price strength above ₹900. Stay patient if below resistance.
"Trade the reclaim, not the breakdown trap."
Information shared is for educational purposes only.
A multi-year symmetrical triangle has been forming on the monthly chart and recently saw a break below lower support.
Interestingly, volume spiked around the breakdown — often signaling a potential shakeout or false breakdown.
The breakdown zone around ₹900 is now acting as resistance. If price reclaims this zone, a strong bullish breakout structure may develop.
Currently, the price is around ₹850 — watching for confirmation above ₹900 for entry.
• Timeframe: Monthly
• Pattern: Symmetrical Triangle
• Outlook: Positional / 6–12 Months
• Plan of Action:
Entry: ₹900+ (on confirmation)
Stop-Loss: ₹666 (swing low / pattern invalidation)
Target 1: ₹1,132
Target 2: ₹1,365
Target 3: ₹1,598
• Why This Setup Stands Out:
Clean symmetrical triangle respected over time
Volume spike at key zone suggests potential smart money activity
₹900 is both technical resistance and a psychological level
Well-defined R:R with multi-target structure
Note: This is a positional idea — enter only on price strength above ₹900. Stay patient if below resistance.
"Trade the reclaim, not the breakdown trap."
Information shared is for educational purposes only.
Bài đăng liên quan
Thông báo miễn trừ trách nhiệm
Thông tin và ấn phẩm không có nghĩa là và không cấu thành, tài chính, đầu tư, kinh doanh, hoặc các loại lời khuyên hoặc khuyến nghị khác được cung cấp hoặc xác nhận bởi TradingView. Đọc thêm trong Điều khoản sử dụng.
Bài đăng liên quan
Thông báo miễn trừ trách nhiệm
Thông tin và ấn phẩm không có nghĩa là và không cấu thành, tài chính, đầu tư, kinh doanh, hoặc các loại lời khuyên hoặc khuyến nghị khác được cung cấp hoặc xác nhận bởi TradingView. Đọc thêm trong Điều khoản sử dụng.