📌 Key Data & Trend Context
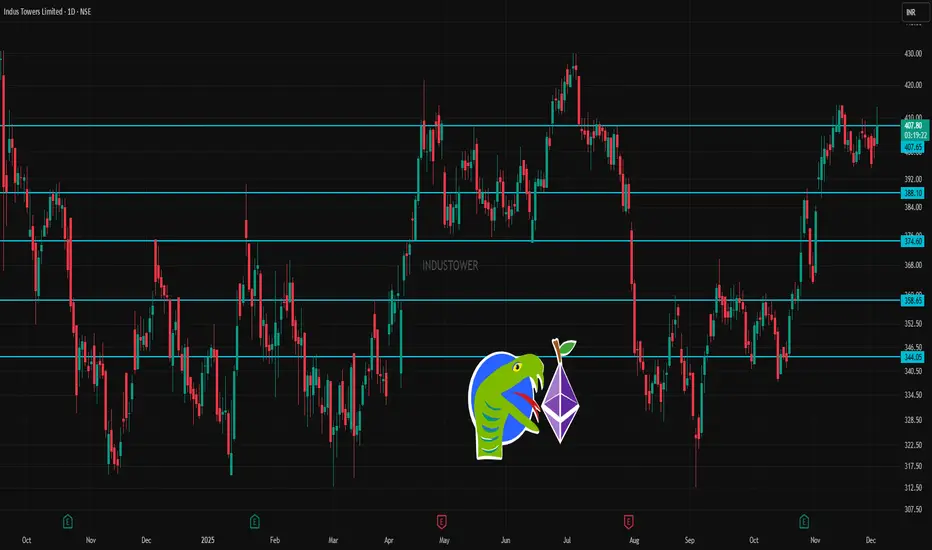
Recent price: around ₹ 404 (or in the ~₹ 401–409 range depending on source/time).
52‑week range: Low ≈ ₹ 312.55, High ≈ ₹ 430.00.
According to moving averages (short‑, mid‑ & long‑term), trend is marked “outperform” / bullish.
✅ What This Suggests (in 1‑day / Short-Term Context)
As long as price holds above ₹ 388–392, the near‑term trend remains stable / bullish.
A close above ₹ 405–408 on decent volume may signal a bullish breakout — could push toward ₹ 424–438 range.
On a drop below ₹ 338–346, the stock could weaken significantly — suggesting caution or a bearish tilt.
Given moving averages (short + mid + long) are in bullish alignment, intermediate‑term bias remains positive.
Bài đăng liên quan
Thông báo miễn trừ trách nhiệm
Thông tin và các ấn phẩm này không nhằm mục đích, và không cấu thành, lời khuyên hoặc khuyến nghị về tài chính, đầu tư, giao dịch hay các loại khác do TradingView cung cấp hoặc xác nhận. Đọc thêm tại Điều khoản Sử dụng.
Bài đăng liên quan
Thông báo miễn trừ trách nhiệm
Thông tin và các ấn phẩm này không nhằm mục đích, và không cấu thành, lời khuyên hoặc khuyến nghị về tài chính, đầu tư, giao dịch hay các loại khác do TradingView cung cấp hoặc xác nhận. Đọc thêm tại Điều khoản Sử dụng.