- Unveil the mesmerizing journey of Indian Oil Corp Ltd (IOC) on this captivating chart!
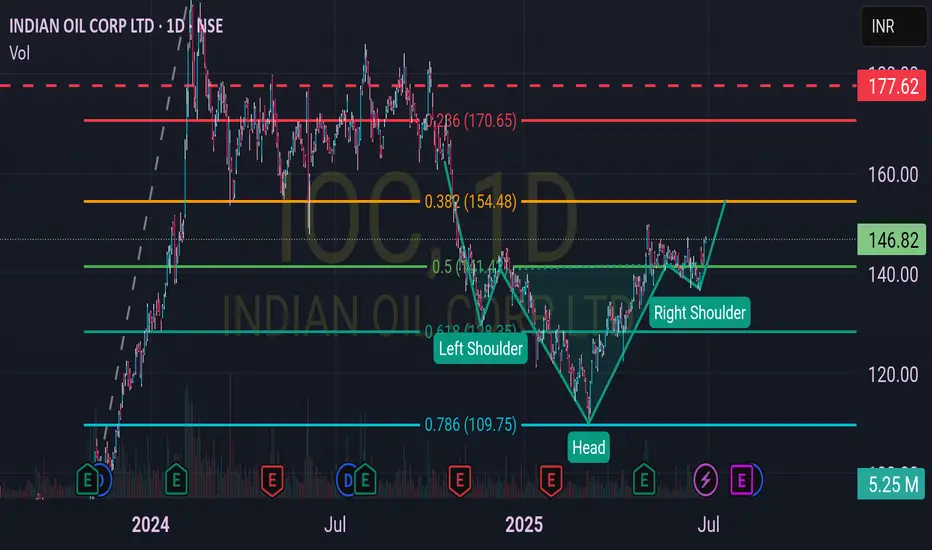
- Behold the Fibonacci levels, meticulously drawn two months ago, revealing a fascinating truth.
- Witness the price action align flawlessly with these golden ratios, a trader's dream come true.
- Marvel at the emerging head and shoulder pattern, hinting at a potential trend reversal.
- Anticipate an exhilarating uptrend as the pattern nears completion, sparking excitement.
- Strategize with a trailing stop from entry, safeguarding your gains with precision.
- Embrace proper risk management to navigate this thrilling market adventure.
- The 0.618 level at ₹154.48 and 0.786 at ₹109.75 have held strong, guiding the price.
- The current price of ₹146.73 teases a breakout, aligning with the right shoulder.
- Prepare for an upward surge, blending Fibonacci magic with pattern perfection!
Thông báo miễn trừ trách nhiệm
Thông tin và ấn phẩm không có nghĩa là và không cấu thành, tài chính, đầu tư, kinh doanh, hoặc các loại lời khuyên hoặc khuyến nghị khác được cung cấp hoặc xác nhận bởi TradingView. Đọc thêm trong Điều khoản sử dụng.
Thông báo miễn trừ trách nhiệm
Thông tin và ấn phẩm không có nghĩa là và không cấu thành, tài chính, đầu tư, kinh doanh, hoặc các loại lời khuyên hoặc khuyến nghị khác được cung cấp hoặc xác nhận bởi TradingView. Đọc thêm trong Điều khoản sử dụng.