📍 Key Levels to Monitor (weekly chart)
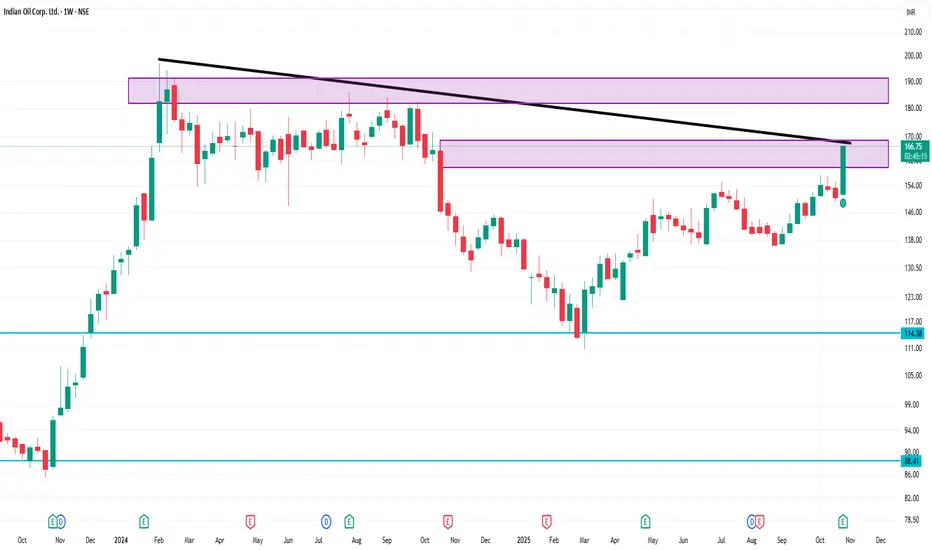
Support zone: ~ ₹150-155. This is a region where past moving averages / consolidation occurred (also near 200-week MA).
Near-term support: ~ ₹160. If price dips, watch for reaction around this level.
Resistance / breakout area: ~ ₹166-170. Past highs / pivot region. If price convincingly breaks above this with volume, higher targets could be triggered. In the daily technicals, pivot-classic R1 ~ ₹166.54.
Next upside potential: If breakout happens, next zone maybe ~ ₹175-180 (psychological+historic highs) — but only once structure is confirmed.
Risk trigger: A close below ~ ₹150 might shift trend bias to more neutral/weak.
Bài đăng liên quan
Thông báo miễn trừ trách nhiệm
Thông tin và các ấn phẩm này không nhằm mục đích, và không cấu thành, lời khuyên hoặc khuyến nghị về tài chính, đầu tư, giao dịch hay các loại khác do TradingView cung cấp hoặc xác nhận. Đọc thêm tại Điều khoản Sử dụng.
Bài đăng liên quan
Thông báo miễn trừ trách nhiệm
Thông tin và các ấn phẩm này không nhằm mục đích, và không cấu thành, lời khuyên hoặc khuyến nghị về tài chính, đầu tư, giao dịch hay các loại khác do TradingView cung cấp hoặc xác nhận. Đọc thêm tại Điều khoản Sử dụng.