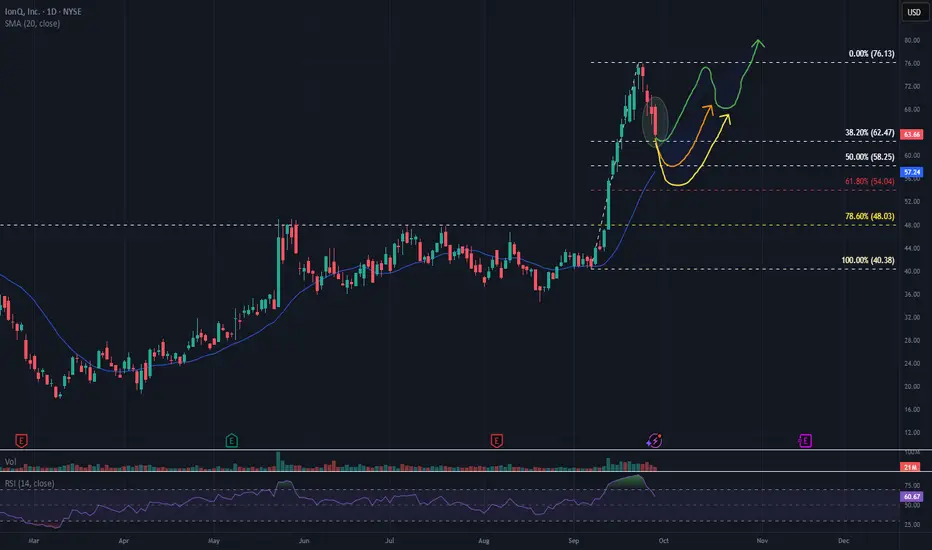
This chart of IonQ, Inc. (NYSE: IONQ) outlines a technical setup identifying three potential buy zones based on Fibonacci retracement levels and anticipated recovery paths:
First Buy Zone – 38.60% Retracement ~63$~~
This level may act as initial support. A bounce here could signal early recovery, especially if volume confirms buying interest.
Second Buy Zone – 50.00% Retracement ($58~~)
Highlighted by a yellow arrow, this zone suggests a short-term dip before a potential rebound. It aligns with a moderate correction and is often considered a strong technical level for accumulation.
Third Buy Zone – 61.80% (54$~~)
This deeper retracement zone is supported by a green arrow, indicating a longer-term recovery path. It may offer a high-reward entry point if the stock stabilizes and RSI confirms oversold conditions.
This analysis is for informational purposes only and does not constitute a recommendation to buy or sell any security. Always conduct your own research or consult a financial advisor before making investment decisions.
Thông báo miễn trừ trách nhiệm
Thông tin và ấn phẩm không có nghĩa là và không cấu thành, tài chính, đầu tư, kinh doanh, hoặc các loại lời khuyên hoặc khuyến nghị khác được cung cấp hoặc xác nhận bởi TradingView. Đọc thêm trong Điều khoản sử dụng.
Thông báo miễn trừ trách nhiệm
Thông tin và ấn phẩm không có nghĩa là và không cấu thành, tài chính, đầu tư, kinh doanh, hoặc các loại lời khuyên hoặc khuyến nghị khác được cung cấp hoặc xác nhận bởi TradingView. Đọc thêm trong Điều khoản sử dụng.