Cập nhật
IOSTBTC
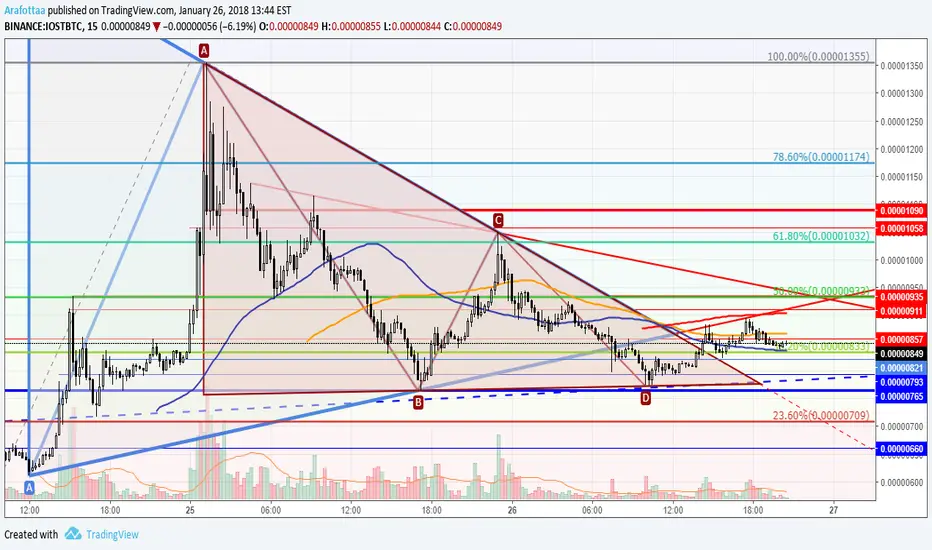
The price broke the channel on the old chart https://www.tradingview.com/chart/IOSTBTC/IxAgiQk1-IOSTBTC/
, the big triangle and the uptrend, but its rebounded above the 0.00000765 level the bottom of the small triangle to broke the triangle and the " 38% Fibonacci " to test the uptrend " bottom line of the big triangle ", but its failed to close over it, So in my opinion the price will try to test " 38% Fibonacci " again to rebound from it to 0.00000911 level.
If the price close under 0.00000821 it will go to 0.00000793 to rebound from it, If the price keep over the " 0.00000857 ", it will go to 0.00000911 to test the uptrend and the downtrend.
If the price close over " 50% Fibonacci 0.00000933 ", it will go to 0.00001090 level.
Ghi chú
The price rebounded from 0.00000796 level above the mentioned level to create third point on the uptrend.Thông báo miễn trừ trách nhiệm
Thông tin và ấn phẩm không có nghĩa là và không cấu thành, tài chính, đầu tư, kinh doanh, hoặc các loại lời khuyên hoặc khuyến nghị khác được cung cấp hoặc xác nhận bởi TradingView. Đọc thêm trong Điều khoản sử dụng.
Thông báo miễn trừ trách nhiệm
Thông tin và ấn phẩm không có nghĩa là và không cấu thành, tài chính, đầu tư, kinh doanh, hoặc các loại lời khuyên hoặc khuyến nghị khác được cung cấp hoặc xác nhận bởi TradingView. Đọc thêm trong Điều khoản sử dụng.