The IOTA/USDT (1W) chart is now entering a critical phase, potentially defining the major market direction heading into 2026.
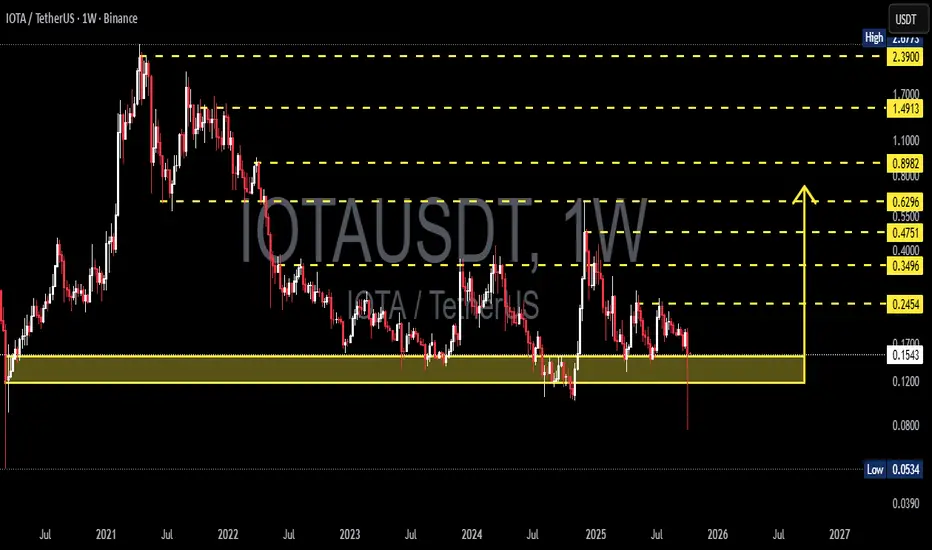
Price is currently hovering right above the key demand zone between $0.15 and $0.12 — a level that has acted as a multi-year support floor since 2022.
Interestingly, the chart shows a long wick below the yellow box, followed by a strong recovery back inside the zone — a classic sign of liquidity absorption or a liquidity grab. This pattern often signals smart money accumulation and can mark the beginning of a macro reversal if confirmed by strong bullish weekly candles and increasing volume.
However, on the broader structure, the market still maintains a series of lower highs since its 2021 peak — meaning that sellers continue to dominate the long-term structure. Therefore, a confirmed breakout remains essential before assuming any sustainable trend reversal.
---
Technical Structure & Key Levels
Major Support (Demand Zone): $0.15 – $0.12
→ A historically strong area that has been tested multiple times over the past three years. How price reacts here will decide whether this is another accumulation phase or a breakdown setup.
Immediate Resistance: $0.245
Mid-Term Resistances: $0.349 → $0.475 → $0.629
High-Value Targets: $0.898 → $1.491 → $2.39
Historical Low: $0.0534 (extreme capitulation level if breakdown occurs).
---
Bullish Scenario — Potential Rebound from the Accumulation Zone
If the weekly candle closes above $0.15 and shows a continuation pattern with increasing volume, a major rebound phase could begin.
Step-by-step targets:
1. $0.245 → initial confirmation of reversal
2. $0.35 – $0.47 → mid-term swing targets
3. $0.63 – $0.89 → broader recovery range
A decisive breakout above $0.245 would mark a shift from bearish to neutral-bullish structure, opening the door for a sustained recovery phase into 2026.
---
Bearish Scenario — Breakdown Toward Historical Lows
If the price closes below $0.12 on a weekly timeframe, the bearish scenario becomes dominant.
Next potential downside targets:
$0.08 → psychological support
$0.0534 → historical capitulation zone
Failure to defend this range would indicate that buyers have lost control, likely triggering a new macro downtrend that revisits multi-year lows.
---
Conclusion
The $0.15–$0.12 zone remains the key battlefield between long-term buyers and sellers.
A successful rebound could mark the start of a new accumulation phase, while a clear breakdown would confirm another leg of the bearish cycle.
The upcoming weekly close will be crucial to determine which side gains dominance.
---
#IOTA #IOTAUSDT #CryptoAnalysis #TechnicalAnalysis #Altcoin #CryptoTrading #SupportResistance #CryptoBullish #CryptoBearish #MarketStructure #PriceAction #SwingTrade
✅ Get Free Signals! Join Our Telegram Channel Here: t.me/TheCryptoNuclear
✅ Twitter: twitter.com/crypto_nuclear
✅ Join Bybit : partner.bybit.com/b/nuclearvip
✅ Benefits : Lifetime Trading Fee Discount -50%
✅ Twitter: twitter.com/crypto_nuclear
✅ Join Bybit : partner.bybit.com/b/nuclearvip
✅ Benefits : Lifetime Trading Fee Discount -50%
Thông báo miễn trừ trách nhiệm
Thông tin và ấn phẩm không có nghĩa là và không cấu thành, tài chính, đầu tư, kinh doanh, hoặc các loại lời khuyên hoặc khuyến nghị khác được cung cấp hoặc xác nhận bởi TradingView. Đọc thêm trong Điều khoản sử dụng.