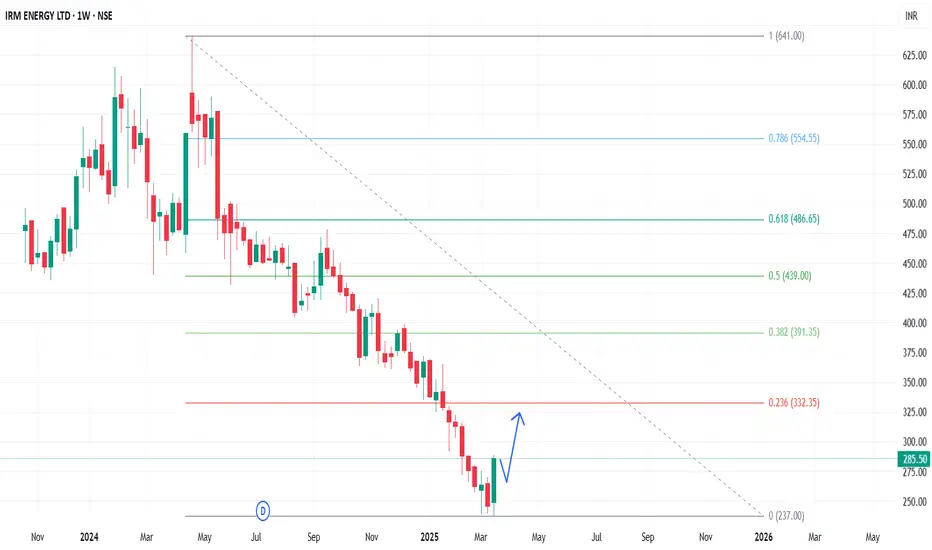
In the Weekly Chart of IRMENERGY ,
we can see that; it has given a W shape recovery from 240 levels.
Let it create a halt candle and then enter with SL & Targets.
Expected momentum is shown in chart.
we can see that; it has given a W shape recovery from 240 levels.
Let it create a halt candle and then enter with SL & Targets.
Expected momentum is shown in chart.
Thông báo miễn trừ trách nhiệm
The information and publications are not meant to be, and do not constitute, financial, investment, trading, or other types of advice or recommendations supplied or endorsed by TradingView. Read more in the Terms of Use.
Thông báo miễn trừ trách nhiệm
The information and publications are not meant to be, and do not constitute, financial, investment, trading, or other types of advice or recommendations supplied or endorsed by TradingView. Read more in the Terms of Use.